Ido Perlman
1. Historical view.
As early as 1865 Holmgren found that a light stimulus could cause a change in the electrical potential of the amphibian eye. Shortly afterwards, similar findings were reported by Dewar from Scotland. He showed that light illumination through the pupil, which had previously been covered, caused a slight movement of a galvanometer, suggestive of a positive electrical change in the cornea relative to the back of the eye (Armington, 1974). This light-induced electrical activity of the eye was called the electroretinogram. Nowadays the electroretinogram response is commonly abbreviated to the ERG.
Gotch (1903) was the first to report that the response of the eye to a light flash consisted of two waves; first the cornea became negative and then a positive wave of larger amplitude appeared. Later Einthoven and Jolly (1908) separated the ERG response into three waves. The first wave to appear immediately after turning on a light stimulus was negative on the cornea. It was followed by a positive wave and a final slower wave that was also positive. Einthoven and Jolly (1908) suggested that the light stimulus triggered a chain of reactions leading to the formation of products A, B and C, and that every electrical wave indicated a change in a ‘relevant’ product. These authors’ work was the foundation for the form of analysis of the ERG used to the present day. The waves are called a-, b- and c-waves. An additional corneal-positive wave, that is more rarely recorded at the termination of the light flash, is called the d-wave.
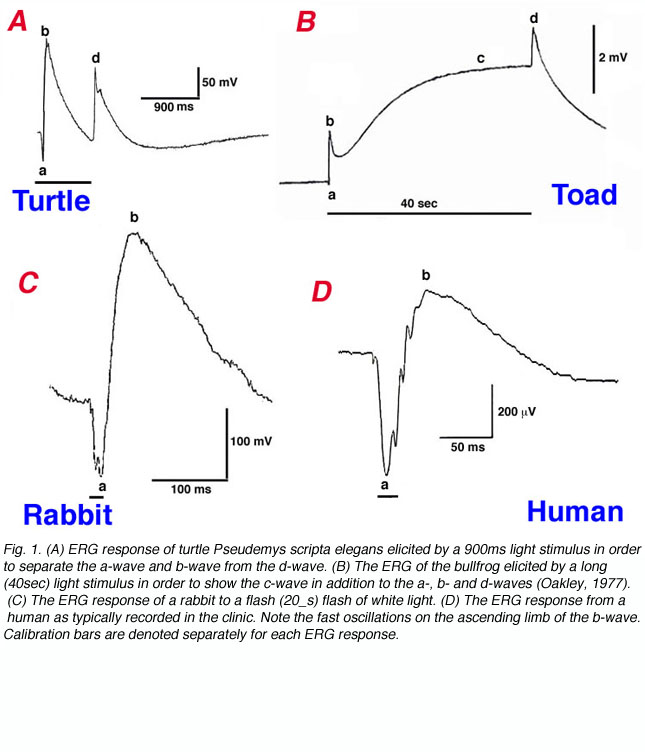
Figure 1 shows ERG responses from different species. These responses are to bright light stimuli applied in the dark-adapted state. The ERG of the turtle eye (Fig. 1A) as elicited by a long (900ms) step of light, shows an a-wave and b-wave complex separated from the d-wave which is generated at stimulus offset. A bright light stimulus of 40sec duration is used to record the ERG of the bullfrog in figure 1B (Oakley, 1977). The a-wave and b-wave are followed by the slow corneal-positive c-wave. After termination of the stimulus, a d-wave develops. The ERG responses of the rabbit (Fig. 1C) and the human (Fig. 1D) are elicited by fast bright flashes (50 or 100ms in duration) and therefore, only the a-wave and b-wave are seen. In the human response (Fig. 1D), fast oscillations can also be seen on the ascending limb of the b-wave. These ERGs in the different species clearly differ in amplitude and pattern. Some of this variability is due to species differences, particularly, the relative densities of rods and cones, while technical factors such as duration and intensity of photostimulation and method of recording also affect the waveform. Nevertheless, ERG responses of turtle, bullfrog, rabbit and human (Fig. 1), in addition to those recorded from other vertebrate species, are characterized by the basic features of a negative a-wave followed by a positive b-wave.
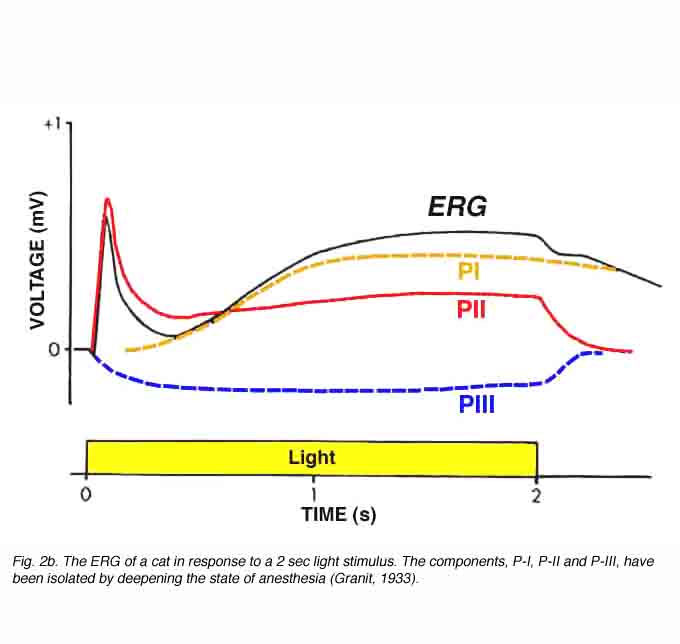
In 1911, Piper published his analysis of the ERG. He divided the ERG into 3 components: I, II and III (Armington, 1974). Unlike Einthoven and Jolly who suggested that the waves reflected transient chemical processes, Piper suggested that all the ERG components lasted for the duration of the light stimulus. According to Piper, the first two waves, I and II, were characterized by different latencies and temporal properties so that the interaction between them resulted in the formation of the a- and b-waves. Wave III was equivalent to the c-wave. Although Piper’s analysis was very speculative and based only on a few facts, this interpretation together with that of Einthoven and Jolly’s has set the basis for the idea that the ERG is the result of a few components. In 1933, Ragnar Granit published a more detailed study of the components of the cat ERG as illustrated in figure 2 (Granit, 1933). He recorded the ERG from the anesthetized cat using corneal electrodes and observed the gradual removal of the different components as the level of anesthesia was deepened. Granit termed the different components in sequence of their disappearance: P-I, P-II and P-III. The P-I component is a slow cornea-positive wave. P-II is also a corneal-positive wave that rises relatively fast to a peak amplitude and then recovers to an intermediate potential while the light stimulus is still on. The last component, P-III, which was the most resistant to the level of anesthesia, is a cornea-negative wave that develops faster than the other two and remains as a negative potential for as long as the light stimulus is on. The component analysis of Granit has been modified slightly over the years but remains the basis for our understanding of the ERG. For his work on the ERG, Ragnar Granit won the Nobel Prize for Physiology and Medicine in 1967.
2. The electrical basis of ERG recordings.
ERG responses are recorded with an active extracellular electrode positioned either on the cornea, in the vitreous or at different levels inside the retina. Extracellular recording of electrical activity of living tissue is rendered possible when electrical currents spread along an extracellular matrix with electrical resistance. An example of extracellular electrical current in the vertebrate retina is the ‘dark’ current spreading from the inner segments to the outer segments of the photoreceptors (see chapter on photoreceptors).
In the vertebrate retina, the photoreceptors are arranged in parallel and therefore, their ‘dark’ currents are in parallel and sum up, giving rise to a strong radial extracellular current flowing away from the inner nuclear layer towards the pigment epithelium. Similarly, extracellular currents from all retinal cell types will sum up only if they are directed radially. In contrast, lateral currents will cancel each other since the retinal lateral arrangement is completely symmetrical. Therefore, when a homogenous light stimulation is directed at the whole retina, only radial extracellular currents are formed. We assume that a light stimulus elicits extracellular electrical currents that flow from sources to sinks. These currents will flow through different pathways including local and remote ones. We can divide these currents into two principal pathways, the local one (A) and the remote one (B) as shown schematically in figure 3a. The current in pathway A, flows through a local route remaining entirely within the retina, while the current flowing through pathway B leaves the retina through the vitreous and anterior ocular tissue and returns to the retina through the sclera, the choroid and the pigment epithelium layer. The light-induced current flowing through pathway B can be recorded in a noninvasive manner, with extra-ocular electrodes, as illustrated in figure 3a.
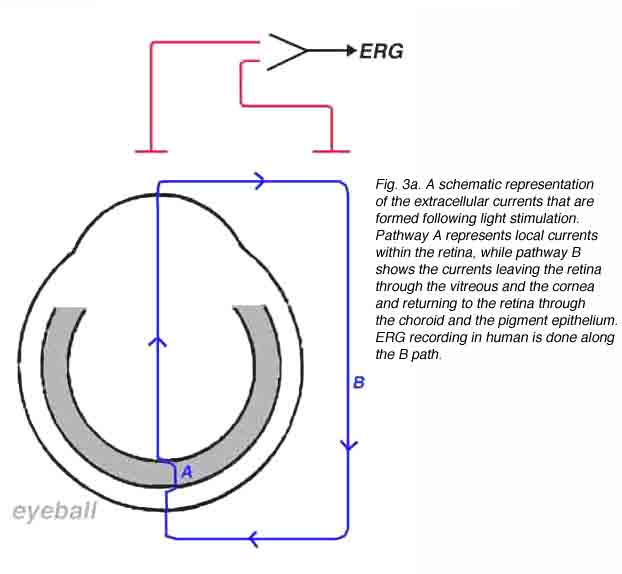

According to Ohm’s law in electricity, when an electrical current flows through a resistor, a gradient of electrical potential is formed that equals the product of multiplying the magnitude of the current by that of the resistance. By applying this law, we can derive the relationships between the currents, IA and IB (Fig. 3a), the resistances of the ocular tissues and the measurements of potential differences. Figure 3b shows an equivalent electrical circuit of the eye (Rodieck, 1973). A light stimulus elicits an extracellular current (source I) that divide into two pathways; one flowing through the retina (local pathway, IA in Fig. 3a) and the other through extra-retinal and -ocular tissues (remote pathway, IB in Fig. 3a). Each tissue (e.g. retina, vitreous, sclera, choroid, pigment epithelium) is represented in figure 3b by an electrical resistor. According to Ohms’ law, the potential difference between two points is independent of the pathway through which the current is flowing. Therefore, the voltage difference between points A and B can be calculated for the local or remote pathways.
IAR1 = IB (R2 + R3 + R4 + R5 + R6) (Equation 1)
Since the sum of the resistances on the right side of the equation (R2 + R3 + R4 + R5 + R6) is larger than R1, the current IA in the local pathway must be greater than current IB.
When using two electrodes to record light-induced electrical activity of the retina, the largest light-induced potential change will be monitored if the measurement is done between points A and B, which are on the two sides of the cells producing the electrical response. However, when the electroretinogram is recorded from humans or from laboratory animals during chronic experiment, the electrodes cannot be inserted into the retina. The alternative is to record from extraocular sites by placing both active and reference electrodes outside the eye. If these electrodes are placed at the loci designated in figure 3b as C and D, the voltage gradient between them is given by
VC – VD = IB * R4 (Equation 2)
or
VC – VD = IAR1 – IB(R2 + R3 + R5 + R6) (Equation 3)
This is the ERG: the light-induced potential change that is related to light-induced electrical activity within the retina. In general, when retinal function deteriorates, the light-induced electrical activity in the retina reduces. The currents IA and IB will be smaller and the ERG will be smaller too thus, indicating retinal pathology
However, we have to remember that the magnitude of the different resistances and more so, the relationships between them can also affect the ERG that is measured with extra-ocular electrodes. The division of the current originating from the light-induced retinal activity into the local and remote pathways depends upon the relative resistances of the two pathways. From Equation (1), we can derive the following relationship
IA/IB = (R2 + R3 + R4 + R5 + R6)/ R1 (Equation 4)
Any change in one of the resistances will cause a change in the magnitude of the current in the extraocular pathway (IB) and the ERG (VC – VD) can change irrespective of retinal function. Therefore, knowledge of the different resistances and understanding the factors that affect them is needed for proper use of the ERG for clinical and/or research purposes.
The pigment epithelium layer (R-membrane) offers the highest resistance to electrical current along the ocular tissues (Brindley, 1956; Brindely and Hamasaki, 1963; Byzov, 1968; Ogden and Ito, 1971) as denoted by a large resistor R6 in figure 3b. Therefore, any change in the magnitude of this resistor will affect the distribution of currents between the retinal pathway (IA) and the remote pathway (IB). This change will be reflected in the ERG responses that are measured with extra-ocular electrodes. Such changes in the distribution of resistances may account for species differences in the magnitude of the ERG responses and for intra-subject differences within a given species. The importance of the resistances of the ocular tissues has been recognized by Arden and Brown (1965). They replaced the vitreous humor of cats with heavy oil in order to abolish current flow from the retina to distant sites and thereby ensured large potential recordings of local ERG from the retinal surface. In the clinical environment, it is well documented that the ERG can be reduced significantly in patients with giant retinal tears who have undergone vitrectomy surgery and injection of silicon oil into the vitreous. Since silicon oil does not conduct electric currents, the resistance of the vitreous increases by several folds causing the current IB to be so reduced that the ERG becomes very small in amplitude (Doslak et al. 1980; Foerster et al. 1985; Doslak, 1988).
3. The origin of the major ERG waves.
Granit (1933) divided the cat’s ERG into three components; P-I, P-II and P-III (Fig. 2). From his analysis, we know that the negative a-wave is the leading edge of the negative P-III component; the positive b-wave reflects the summation of P-II and P-III while the slow c-wave is the summation of P-I and P-III. However, the cellular origin of the different components needs to be understood. Basically, two types of approaches, physiological and pharmacological, have been used to dissect out these cellular origins. The physiological experiments are based on the assumption that the generators of specific ERG components are located in specific retinal layers and therefore, when these are passed by the intra-retinal microelectrode, the polarity of the specific ERG waves will reverse. These current source-density analyses have indeed revealed the anatomical location within the retina of the different ERG components. The pharmacological approaches to ERG analyses are based on retinal physiology and biophysics. In these experiments, specific agonists and antagonists of cellular mechanisms are applied and their effects on the ERG then analyzed.
In the following section, the sources of the a-, b- and c-waves will be discussed, not according to the order of their timing in the ERG response but according to the retinal level at which they are generated, starting from the most distal layer, the pigment epithelium.
3.1 The c-wave:
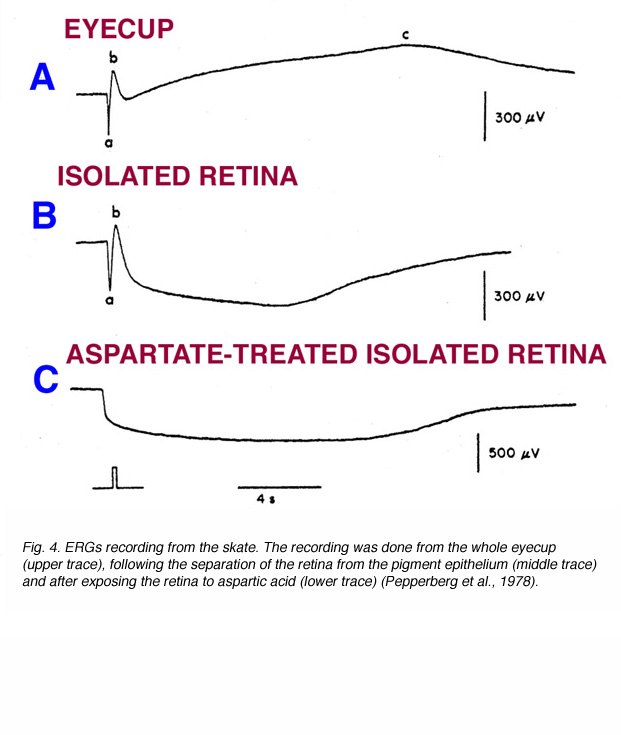
The c-wave, which corresponds to the P-I component of Granit (Fig. 2), is now known to originate in the pigment epithelium. The first indication of this was reported by Noell (1954). He showed that systemic injection of sodium azide elicited an electrical potential from the retina similar to the ERG c-wave. The azide-induced potential was not influenced by iodoacetic acid, which is known to destroy photoreceptors, or by cutting the optic nerve, which causes degeneration of the ganglion cells. This interpretation of the c-wave origin was proven directly when intracellular recordings were made from pigment epithelial cells. The potential changes that were recorded from these cells in response to light stimuli were identical in shape and temporal properties to the ERG c-wave (Steinberg et al., 1970). Furthermore, when the retina was separated from the pigment epithelium, the ERG response contained normal a- and b-wave, but the c-wave disappeared. Figure 4 shows ERG recording from the skate eyecup that consists of a-wave, b-wave and c-wave (upper trace). When the retina is separated from the sclera and pigment epithelium, the ERG response contains only the a- and b-waves. Furthermore, aspartate, by blocking transmission from photoreceptors to bipolar cells, completely removes the b-wave (Fig. 4) (Pepperberg et al., 1978).
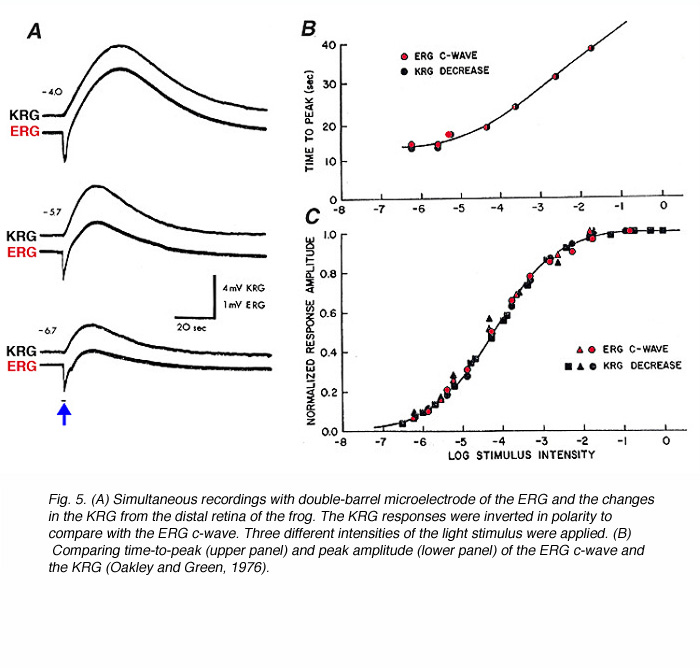
The exact mechanisms whereby the pigment epithelial cells generate the c-wave were revealed only when potassium-sensitive microelectrodes were developed. The pigment epithelium cells are functionally asymmetrical cells with their basal membrane (toward the choroid) less permeable to potassium ions than the apical membrane (retinal side). This asymmetry causes a constant potential difference between the retina and the choroid with the retinal side positive relative to the choroidal side. This is also called ‘The standing potential of the eye’. The standing potential is very sensitive to the extracellular concentration of potassium ions. Any change in concentration of potassium ions at one side will be expressed in a change in the whole trans-epithelial potential. Measurements with potassium-sensitive microelectrode in the photoreceptor layer shows a light-induced decrease in the extracellular concentration of potassium ions, due to light-induced electrical activity in the photoreceptors. The reduction in the extracellular concentration of potassium ions near the apical membrane of the pigment epithelial cells is expressed as an increase in the trans-epithelial potential with the retinal side becoming more positive relative to the choroidal side. This is the ERG c-wave when recorded with a corneal electrode (Oakley and Green, 1976; Oakley, 1977). Figure 5 shows simultaneous recordings of the ERG and the potassiumretinogram (KRG) in the frog retina. To simplify the comparison, the KRG responses are inverted, thus a positive deflection in this figure means a reduction in extracellular concentration of potassium ions. The intensity series (Fig. 5A) indicates that the temporal properties of the KRG match closely with those of the ERG c-wave. The intensity-response curves show excellent correlation between peak amplitude of the c-wave and peak reduction in potassium concentration (Fig. 5B).
Although the c-wave originates from the pigment epithelium, it depends upon the integrity of the photoreceptors, because light absorption in the photoreceptors triggers the chain of events leading to the decrease in extracellular concentration of potassium ions. Therefore, the ERG c-wave can be used to assess the functional integrity of the photoreceptors, the pigment epithelial cells and the interactions between them.
3.2 The a-wave:
The ERG a-wave is the leading part of Granit’s P-III component. It has now been shown that P-III can be divided into a further two components: a fast P-III and a slow P-III (Murakami and Kaneko, 1966; Sillman et al., 1969a). The most important information on the origin of these waves was obtained from ERG recordings with intra-retinal microelectrodes (Tomita, 1950; Brown and Wiesel, 1961a, 1961b; Brown and Murakami, 1964a; Brown, 1968). These studies suggested the photoreceptor layer as the origin of the fast P-III wave. Differential recording in the rat retina using two microelectrodes revealed that the a-wave resulted from extracellular radial current. This is the ‘light’ current and basically reflects the reduction in the ‘dark’ currents due to light absorption in the photoreceptor outer segments, and closure of cGMP-gated cationic channels (see chapter on photoreceptors)(Penn and Hagins, 1969; Sillman et al., 1969b).
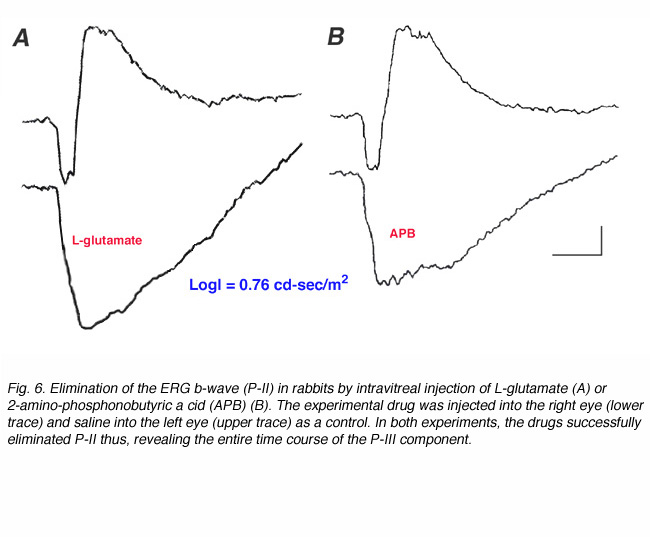
A pharmacological approach to the study of the origin of the ERG a-wave became possible when the identity of the neurotransmitter released from the photoreceptors became known. Since L-glutamate is the neurotransmitter of the photoreceptors, exposing the retina to agonists or antagonists of L-glutamate can effectively block synaptic transmission from the photoreceptors and isolate the contribution of the photoreceptors to the ERG. This can be achieved by exposing the isolated skate retina to L-aspartate, an excitatory acidic amino acid (Fig. 4, lower trace). Figure 6 shows ERG responses from dark-adapted rabbits that were recorded 3 hours after intravitreal injection of L-glutamate or 2-amino-phosphonobutyric acid (APB) into one eye and saline into the fellow control eye (A and B respectively). Both drugs effectively isolate the P-III component of the ERG in the experimental eye, compared to the control eye. These and numerous other studies indicate that the P-III component of the ERG, or more specifically the fast P-III, reflects light-induced activity of the photoreceptors. This component of the ERG is also referred to as “the receptor component”.
The slow component of the P-III cannot be identified in a regular ERG response due to the large amplitude positive P-I wave. However, by separating the retina from the pigment epithelium, P-I can be eliminated and by exposing the retina to drugs, such as aspartic acid, that block synaptic transmission from the photoreceptors to the neurons in the inner nuclear layer, the P-III component can be isolated and studied (Witkovsky et al., 1975). Measurements of the extracellular concentration of potassium ions and of the isolated P-III component of the ERG at different retinal depths reveal the involvement of retinal glial (Müller) cells in the generation of the slow P-III. The Müller cells are highly permeable to potassium ions. Therefore, the reduction in the extracellular concentration of potassium ions in the photoreceptor layer, due to light absorption in the photoreceptors, elicits changes in the trans-membrane potential of the Müller cells and is expressed as the slow P-III component of the ERG.
3.3 The b-wave:
The ERG b-wave has been the subject of extensive research by many groups because it is the major component of the human ERG recording as used in clinical and experimental analysis of retinal function. The data in figures 4 and 6 clearly indicate that the b-wave originates in retinal cells that are post-synaptic to the photoreceptors. Blocking synaptic transmission from the photoreceptors to second order retinal neurons by saturating the post-synaptic receptors with L-aspartate (Fig. 4) or L-glutamate (Fig. 6A), eliminates the ERG b-wave and isolates the P-III component. In fact, any procedure that blocks synaptic transmission from the photoreceptors, like superfusion with cobalt ions or with high magnesium low calcium solutions, will eliminate the ERG b-wave (Furakawa and Hanawa, 1955; Sillman et al., 1969a; Pepperberg and Masland, 1978). The b-wave is also eliminated when the blood flow through the central retinal artery is blocked either intentionally in laboratory animals (Noell, 1954; Brown and Watanabe, 1962), or in human patients (Nilsson, 1971). Since the neural retina is supplied by the retinal vasculature and the photoreceptors by the choroidal plexus, this experimental manipulation, or pathological cases, effectively eliminates light-induced electrical activity in the neural retina from the photoreceptors.
Applying sink-source analysis to electrophysiological recordings of the intra-retinal ERG responses at different retinal depths further reveals the location of the b-wave (P-II) generators. Faber (1969) was the first to calculate the extracellular currents that underlie the ERG b-wave of the rabbit eye. He reported that a sink for the b-wave was in the distal part of the retina, most probably in the outer plexiform layer, while the source was distributed proximally and distally to the sink. The only retinal elements that have a spatial distribution similar to the b-wave sources and sinks are the Müller glial cells. Indeed intracellular recording from Müller cells in the Necturus retina supported Faber’s ideas (Miller and Dowling, 1970). The slow depolarizing response of Müller cells to a light stimulus followed a temporal pattern, similar to that of the ERG b-wave recorded from the same retina. Furthermore, the amplitude-stimulus intensity relationship was similar for the Müller cell photoresponses and the ERG b-wave. Based on these observations, Miller and Dowling (1970) suggested that depolarization of the Müller cell membrane in the distal retina resulted in extracellular currents that were expressed as the b-wave. A change in the extracellular concentration of ions that permeate through the Müller cells’ membrane may cause a change in membrane potential. The most effective are potassium ions (Miller, 1973).
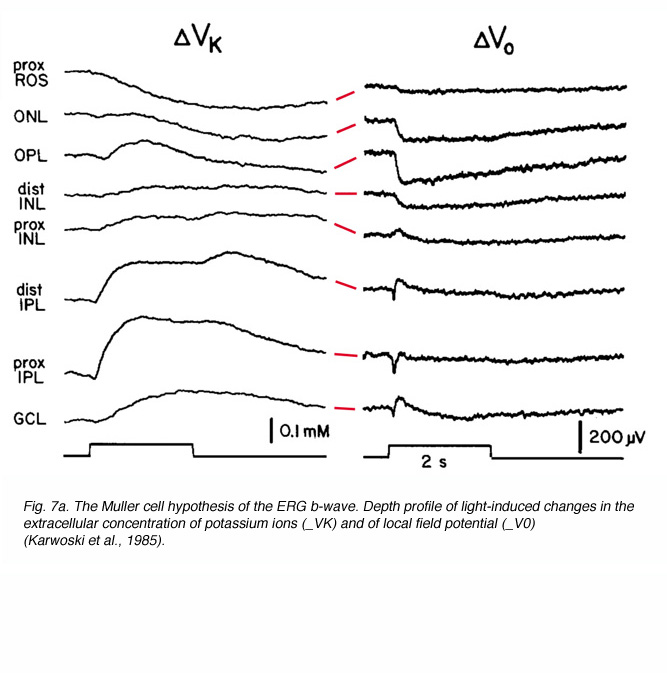
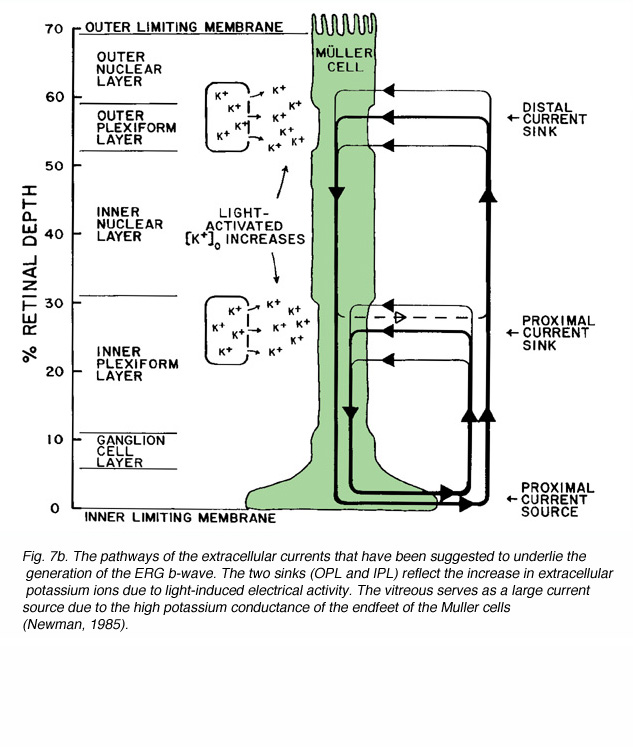
The idea that the b-wave results from changes in the membrane potential of the Müller cells due to light-induced changes of extracellular potassium concentration, underlies the basis for the “Müller-cell Hypothesis”. Since first proposed, this idea has been tested by many investigators using intracellular recordings from Müller cells, measurements of extracellular concentrations of potassium and recording the ERG at different retinal depths. Studies were done in mudpuppy (Karwoski and Proenza, 1980; Karwoski et al., 1985), frog (Newman, 1980; Newman and Odette, 1984; Newman, 1985), fish (Kline et al., 1978, 1985), rabbit (Dick et al., 1985; Karwoski and Xu, 1999), cat (Brown and Wiesel, 1961a, 1961b; Arden and Brown, 1965) and monkey (Heynen and van Norren, 1985a, 1985b). These and other studies reported a light-induced increase in extracellular potassium in the outer and inner plexiform layers. This increase was thought most likely due to leakage from depolarizing retinal neurons. It was assumed that the origin of potassium increases in the outer plexiform layer was bipolar cells, most specifically ON-center bipolar cells that were depolarized by light (Dick and Miller, 1985). In the inner plexiform layer, the increase in extracellular potassium resulted from light-induced activity of amacrine and ganglion cells (Karwoski and Proenza, 1977; Dick and Miller, 1985). The change in potassium alters the membrane potential of Müller cells, generating electrical currents in these two regions of the Müller cell, and exiting through its distal and proximal ends (Ripps and Witkovsky, 1985). Depth recordings of extracellular concentration of potassium and of local field potentials are shown in figure 7A (Karwoski et al., 1985). The reduction of [K+]o in the photoreceptor layer and the increase in the outer and inner plexiform layers are clearly seen. Current source-density analysis of data like these (Fig. 7A) led to the current pathways shown in figure 7B (Newman, 1985).
More evidence concerning the source of the ERG b-wave was gained with specific agonists and antagonists to glutamate receptors. Exposing the vertebrate retina to 2-amino-4-phosphonobutyric acid (APB), a specific agonist of glutamate metabotropic receptors, eliminates the ERG b-wave (Gurevich and Slaughter, 1993) as shown in figure 6B. Since APB-sensitive metabotropic glutamate receptors are found only in ON-center bipolar cells (Slaughter and Miller, 1981), this finding constitutes a clear indication of the involvement of these bipolar cells in the generation of the b-wave. Further support came from experiments in which the effects of 6,7-dinitroquinoxaline-2,3-dione (DNQX) upon the ERG were tested. This drug is a specific antagonist to AMPA/KA type glutamate receptors, and enhances the b-wave, probably by removing current sources that oppose those forming the b-wave. In primates, Sieving and coauthors (1994) propose that the b-wave of the photopic ERG response are mainly contributed by the ON-center bipolar cells but are opposed by OFF-center bipolar cells. This lead to a “push-pull model’ of these cell types (Sieving et al., 1994). More recent detailed sink-source analyses (Karwoski and Xu, 1999), pharmacological dissection of the ERG (Green and Kapousta-Bruneau, 1999) and experiments with mGluR6 knockout mice (Masu et al. 1995)(mGluR6 is the specific receptor for photoreceptor to ON-bipolar transmission in the retina, see chapter on bipolar cells) points directly to the ON-center bipolar cells as generating the ERG b-wave without the Müller cells.
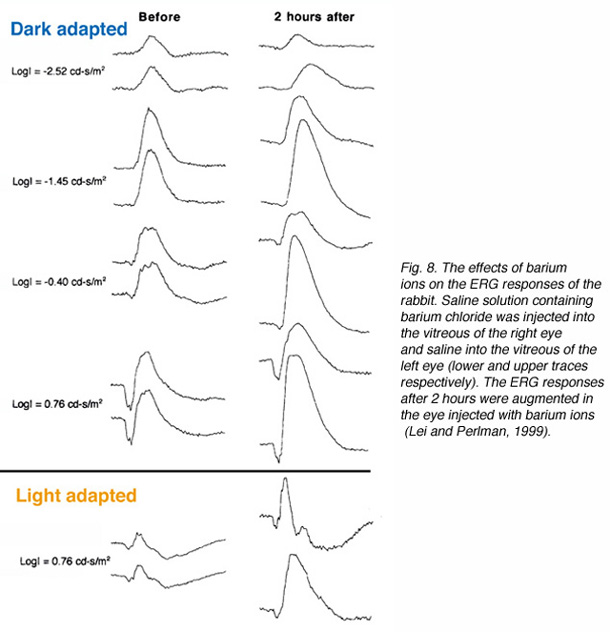
Experiments with injection of barium ions into the vitreous of rabbits did not eliminate the ERG b-wave. Under certain conditions barium ions even caused augmentation of the b-wave as shown in figure 8 (Lei and Perlman, 1999). Since barium ions block almost completely the potassium permeability of Müller cells (Newman, 1989; Reichelt and Pannicke, 1993; Linn et al., 1998), the dose used was expected to abolish the ERG b-wave if the Müller cell hypothesis for the b-wave generation was correct. This was not the case as shown by the ERG response in figure 8. The effects of barium chloride solution injected into the vitreous of one eye, while saline was injected into the vitreous of the other eye, were tested. The ERGs of the experimental eye that was being injected with barium chloride are augmented compared to those of the control eye. This observation opposes the Müller cells hypothesis for the ERG b-wave and thus, supports the ON-center bipolar cell hypothesis.
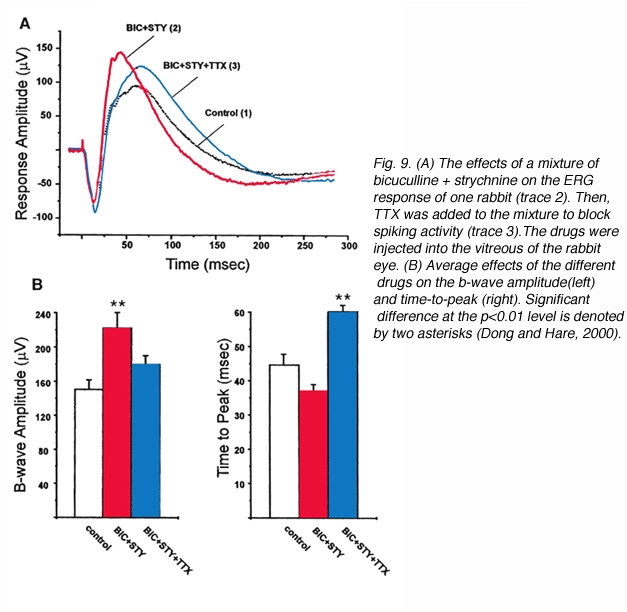
Even more recent studies have searched for inner retina contributions to the ERG b-wave. Using tetrodotoxin (TTX) to block action potentials in third-order retinal neurons (amacrine and ganglion cells), and specific antagonists to GABA and glycine receptors, it was concluded that third-order neurons contributed to the amplitude and kinetics of the ERG b-wave (Dong and Hare, 2000). Since the a-wave is the sum of P-III and P-II, the a-wave is also affected by TTX application. In figure 9A, bright flash ERG responses from the rabbit are shown in control conditions and after intravitreal injection of bicuculline and strychnine to block respectively GABAA and glycine receptors, and after addition of TTX. The basic waveform of the ERG (a-wave b-wave complex) was not changed by these drugs however, after bicuculline and strychnine, the b-wave was augmented indicating removal of inhibitory contributions. After TTX the b-wave was slightly reduced but was mainly delayed indicating the removal of a fast component. Averages(+/- s.d.) of the effects of the above drugs in 5 rabbits are shown in figure 9B. The data indicate that the amplitude of the b-wave is significantly increased by the mixture of bicuculline + strychnine, while TTX significantly delays the time-to-peak. The above conclusion are supported by another study on the retina-eyecup preparation of the tiger salamander, showing that drugs disrupting the activity of third order neurons cause enhancement of the b-wave (Awatramani et al., 2001). The b-wave is also found to be affected by drugs that modulate GABAC-type receptors indicating that negative feedback from amacrine cells onto bipolar cells can shape the photoresponses of the bipolar cells and thus, the amplitude and kinetics of the ERG b-wave (Dong and Hare, 2002). GABAA and GABAC pathways are also found to affect the ERG b-wave of the rat retina (Kapousta-Bruneau, 2000). Bicuculline, the antagonist for GABAA-type receptors augments the b-wave, while, 3-aminopropylphosphono acid (3-APMPA), the antagonist for GABAC-type receptors reduces it.
4. Additional minor components of the ERG
In addition to the three major waves (a, b and c), other components can be identified in the ERG depending upon the experimental recording conditions. Some of these serve for evaluation of human retinal function in the clinic, while others are mainly used for research purposes.
4.1 The early receptor potential (ERP):
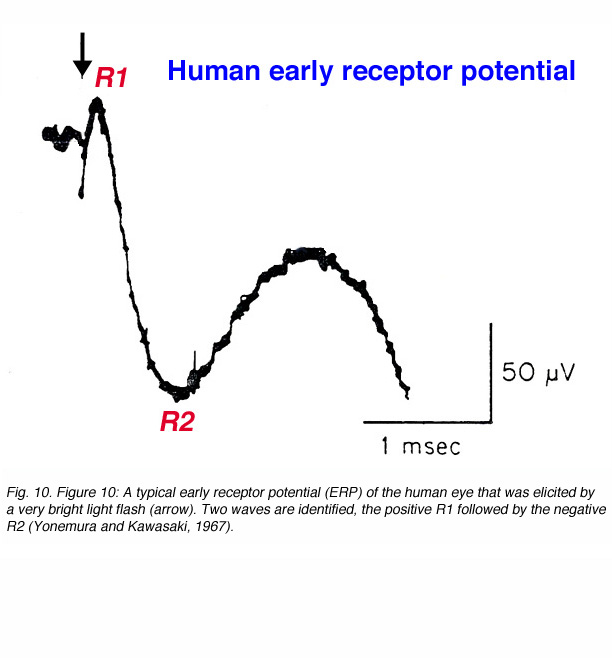
This component of the light-induced activity of the eye was first revealed when a very bright light flash was used to stimulate the monkey eye (Brown and Murakami, 1964a, 1964b), the rat eye (Cone, 1964) or the human eye (Yonemura and Kawasaki, 1967). This electrical response appears immediately after stimulus onset and has a biphasic pattern as shown in figure 10. The ERP in humans ends within 1.5ms and is followed by the a-wave. Depth recordings of the ERP with microelectrodes and intracellular recordings led to the conclusion that the ERP originated in the photoreceptors (Brown et al., 1965; Murakami and Pak, 1970). The amplitude of the ERP depends directly upon stimulus intensity and the concentration of visual pigment in the outer segments of the photoreceptors. Therefore, the ERP is believed to reflect dipole changes in the visual pigment molecules due to conformational changes that are elicited by photon absorption. The ERP has been used in research to follow non-invasively the concentration of the visual pigment during light adaptation and in the dark following an exposure to bright light that causes substantial pigment bleaching (Hodgkin and O’Bryan, 1977). In humans, ERP recording have been done only occasionally in order to estimate rhodopsin density in patients suffering from retinitis pigmentosa, a photoreceptors disease (Berson and Goldstein, 1970a, 1970b). Furthermore, it was shown that carriers of X-linked retinitis pigmentosa, who had no visual defects, could be identified by their reduced ERP recordings (Berson and Goldstein, 1970b).
4.2 The oscillatory potentials (OPs):
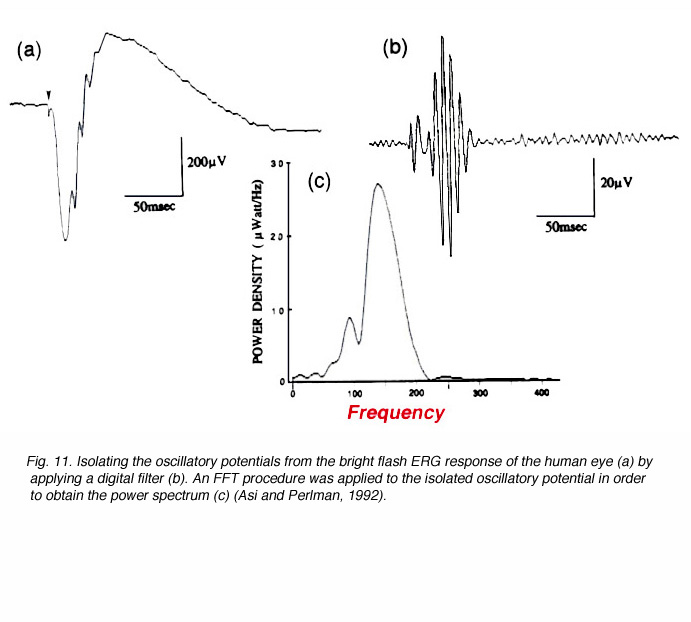
When a bright light stimulus is used to elicit the ERG in humans or in animals, low amplitude oscillating waves can be identified on the rising phase of the b-wave. These wavelets are much faster than the complex of the a- and b-waves. Their frequency is in the range of 100-150Hz and they are best isolated by using a band-pass filter on the ERG wave to eliminate the slow, large amplitude a- and b-waves. An example is shown in figure 11 (Asi and Perlman, 1992). The small amplitude fast wavelets can be seen in the ERG response (Fig. 11a) but they cannot be measured. When an appropriate digital filter is applied and the amplification increased, the oscillatory potentials are isolated (Fig. 11b). A Fast Fourier Transform (FFT) can be applied in order to derive the power spectrum (Fig. 11c) and quantitative assessment of the amplitude and frequency of these potentials.
Depth recordings reveal that the OPs attain maximum amplitude when the microelectrode is in the inner retina (Brown, 1968). Since the amplitude-stimulus intensity of the OPs differs significantly from that of the b-wave, it is thought that these waves are generated in the inner plexiform layer (Ogden, 1973; Wachtmeister and Dowling, 1978). The exact cellular origin of OPs is not yet known for certain. Pharmacological studies and depth recordings lead us to believe they reflect extracellular electrical currents generated by negative feedback pathways between amacrine cells, ganglion cells and bipolar cells (Wachtmeister and Dowling, 1978; Yonemura and Kawasaki, 1979; Heynen et al., 1985).
OPs are very sensitive to ischemia in localized retinal areas. Therefore, in situations where the a- and b-waves remain normal in waveform and amplitude, OP recordings can indicate mild retinal ischemia in the inner retina (Speros and Price, 1981). Such occurs in diabetic retinopathy. Thus OP recordings have sometimes been used as an indicator of background diabetic retinopathy (Larsen et al., 1980; Simonsen, 1980; Bresnick and Palta, 1987; Asi and Perlman, 1992).
4.3 The d-wave:
The d-wave is seen only when the ON and OFF phases of the ERG response are separated in time, by using light stimuli of relatively long duration (>100ms). Current source-density analysis shows its source to be the OFF-center bipolar cells (Xu and Karwoski, 1994, 1995). Pharmacological studies in amphibian retinas (Stockton and Slaughter, 1989; Gurevich and Slaughter, 1993; Szikra and Witkovsky, 2001) and in primates (Sieving et al., 1994), using selective blockers for ON bipolar cell glutamate metabotropic receptors and OFF bipolar cell AMPA/KA type receptors, have shown that the d-wave of the ERG depends entirely on AMPA/KA type synaptic transmission i.e. between photoreceptors and OFF-center bipolar cells.
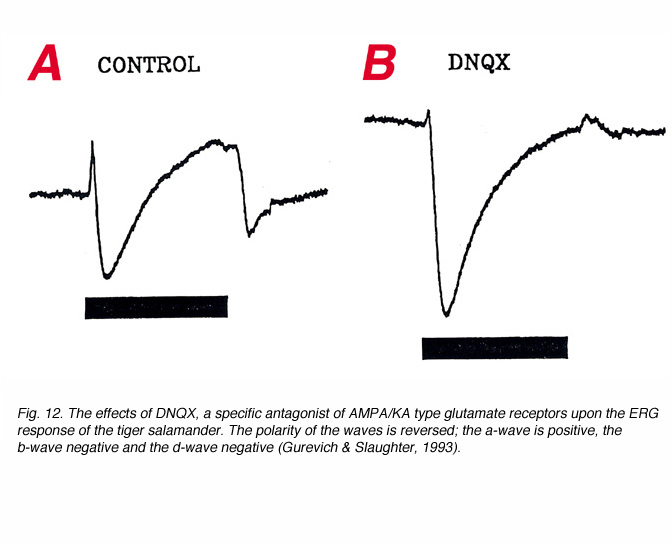
This is shown in figure 12. In this figure, responses were recorded with a microelectrode in the distal retina and therefore, the polarities of the waves are opposite to that obtained with the active recording in the proximal retina, or vitreous or cornea. The a-wave is positive, the b-wave negative and the d-wave negative. After exposure to DNQX, a specific antagonist for AMAP/KA type glutamate receptors, the a-wave is reduced, the b-wave enhanced and the d-wave reverses in polarity (Fig. 12b). The enhancement of the b-wave reflects the removal of opposing contribution from third order retinal neurons (Dong and Hare, 2000; Awatramani et al., 2001). The reduction in the amplitude of the a-wave does not reflect a direct action of DNQX, but rather the enhancement of P-II that usually opposes P-III. The reversal in polarity of the d-wave reflects its origin in OFF-center bipolar cells. Third order retinal neurons may also contribute to the ERG d-wave (Awatramani et al., 2001).
The d-wave can be recorded only with prolonged light stimuli. With light stimuli of shorter durations the d-wave tends to combine with the b-wave. This phenomenon led early studies of patients with congenital stationary night blindness (CSNB) or with melanoma associated retinopathy (MAR) to conclude that the cone system was functioning normally and only the rod system was affected. The use of light stimuli of long duration revealed that the ON pathway in both rod system and cone system was affected and only the OFF pathway of the cone system exhibited normal function (see chapter on bipolar cells)(Miyake et al., 1987; Alexander et al., 1992).
4.4 Scotopic threshold response (STR):
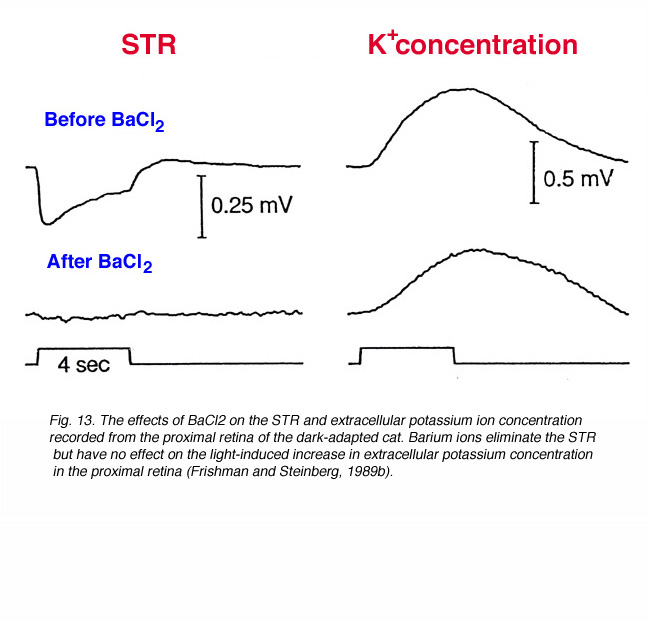
When very dim light stimuli (below the P-II threshold) are applied in the dark-adapted state, a slow corneal negative potential is recorded from toad (Gouras, 1958), cat (Arden and Brown, 1965; Sieving et al., 1986a), sheep (Knave et al., 1972), monkey (Wakabayashi et al., 1988) and humans (Finkelstein et al., 1968; Sieving and Nino, 1988). This potential was called the scotopic threshold response (STR) to indicate that it was recorded with light stimuli near rod threshold. Simultaneous recording of field potentials and potassium concentrations with double-barreled electrodes, at different retinal depths of the dark-adapted cat retina, indicates that the STR originates from light-induced changes in the extracellular concentration of potassium ions in the proximal retina (affecting the membrane potential of Müller cells) (Sieving et al., 1986a; Frishman and Steinberg, 1989b). Barium ions that block potassium conductance of the Müller cells, but not light-induced increase in extracellular potassium concentration, also eliminate the STR as shown in figure 13 (Frishman and Steinberg, 1989b).
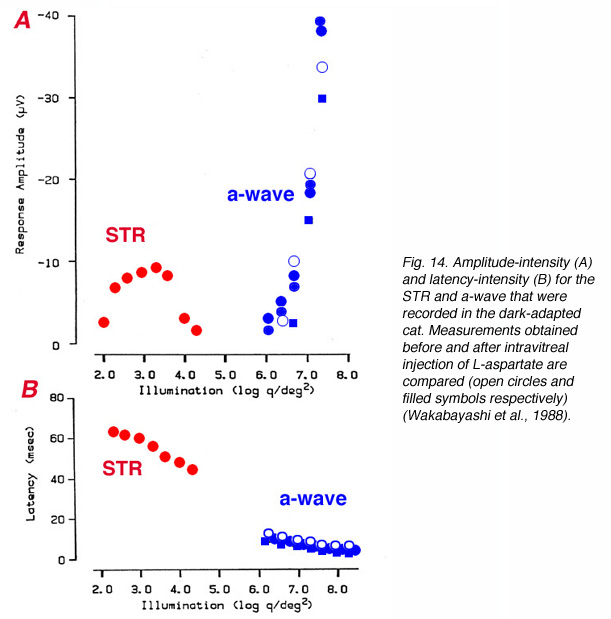
Since the STR is a corneal negative component that is sometimes followed by a positive component, it resembles the ERG a-wave/b-wave complex and can be misinterpreted. In a detailed study in cat and monkey, it was found that the STR could be eliminated by aspartate while the a-wave that was elicited by bright light stimuli was spared, supporting the post-receptoral origin of the STR (Wakabayashi et al., 1988). Figure 14 compares amplitude-intensity (A) and latency- intensity (B) data for cat STR and a-wave in normal conditions and after intravitreal injection of L-aspartate (Wakabayashi et al., 1988). The STR responses were recorded with light stimuli that were dimmer by more than 3 log units. L-aspartate eliminated the STR but did not affect the a-wave.
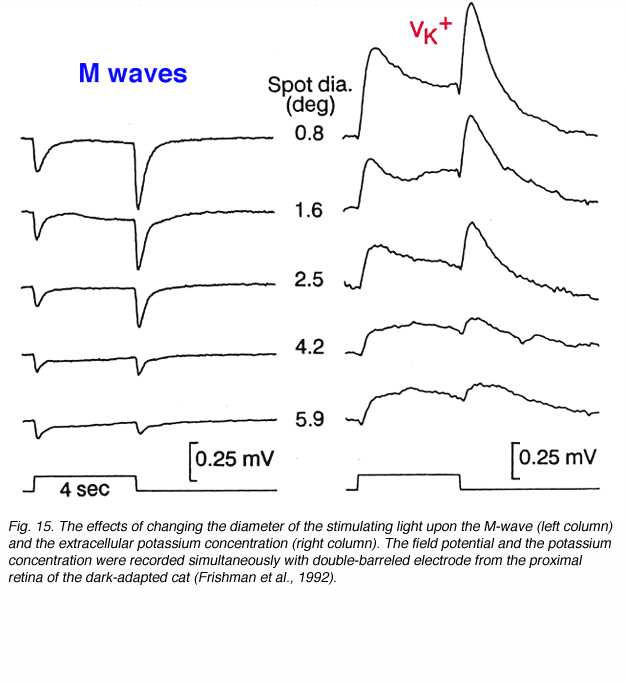
4.5 The M-wave:
The M-wave was first described in cold-blooded vertebrates as a negative going potential change at stimulus onset and offset (Karwoski and Proenza, 1977). The M-wave has also been described in the light-adapted retina of the cat (Sieving et al., 1986b; Frishman et al., 1992). It was proposed to represent changes in membrane potential of Müller cells due to light-induced increases in the extracellular potassium in the proximal retina (Karwoski and Proenza, 1977, 1980). This suggestion was later supported by experiments in which barium ions, used to block the potassium conductance of Müller cells, eliminated the M-wave (Karwoski et al., 1989).
We can learn more about the M-wave from simultaneous recordings of field potentials and potassium concentrations at different retinal depths under changing light stimulation and modulating the activity of the ON- and OFF-channels by specific drugs. Figure 15 compares the M-wave to potassium changes for different spot sizes of light. The M-wave is composed of ON and OFF waves that decrease in amplitude as the stimulus diameter is increased. The light-induced potassium increases are of similar waveform; transient increases at stimulus onset and offset. The relationship to the diameter of the stimulating light is similar. These experiments support the hypothesis that the M-wave, in the light-adapted cat retina, is due to changes in extracellular potassium concentration in the proximal retina and to activity in both ON and OFF channels (Frishman et al., 1992). Adding barium ions to block potassium conductance of the Müller cells does not completely eliminate the M-wave. A small, sustained depolarizing component is seen at light onset plus a negative OFF component. Evidently, direct neuronal contributions cause the M-waves, and the major contribution is to the OFF wave (Frishman et al., 1992).
The ERG results discussed here and in the previous section (4.4) indicate similarities between the STR and the M-wave. Both are negative-going field potentials that reflect the effects of light-induced potassium changes upon the Müller cells in the proximal retina. The difference between these field potentials arises from their photoreceptor basis. While the STR reflects rod-mediated vision, the M-wave is dominated by the cone system. Therefore, the former is a slow potential at stimulus onset recorded in the dark-adapted retina, while the latter contains ON and OFF components and is recorded in light-adapted conditions (compare Figs. 13 and 15). Furthermore, the STR seems to be solely dependent upon potassium-Müller cell interactions, while the M-wave reflects also direct contributions from neuronal activity particuarly to its OFF component.
5. Summary of the ERG components
The ERG is an electrical response of the eye and is made up of several components. In the previous sections, the major and minor components of the ERG were described and their cellular origins discussed. Researchers and clinicians who are interested in objective assessment of retinal function need to become familiar with the ERG waves. With proper analysis, the functional integrity of different retinal structures can be dissected out and we are able to understand information processing mechanisms and/or the sites of retinal disorders.
The ERG originates from extracellular currents that are generated in response to a light stimulus. In the ophthalmic clinic, the most common recording of ERG responses contains the negative a-wave and the positive b-wave. Light absorbance by the visual pigment molecules in the outer segments of the photoreceptors reduces the ‘dark’ current and therefore, can be viewed as eliciting a ‘light’ current. This current is expressed as a negative wave when recorded from the vitreous or the cornea and constitutes the fast P-III (the receptor potential). The a-wave of the electroretinogram is the leading edge of the fast P-III and therefore, reflects the functional integrity of the photoreceptors. However, the amplitude of the a-wave also depends upon the development of the positive Granit’s P-II component. Early development of P-II will result in subnormal a-wave, while a slow P-II will be expressed in supernormal a-wave. Any analysis that allows separation of P-III from the overall ERG response will provide valuable information about the photoreceptors.
The exact source of the ERG b-wave is still under dispute. The major contribution comes from light-induced activity in ON-center bipolar cells. The extracellular currents that generate the b-wave either originate directly in these cells or reflect potassium-induced changes in the membrane potential of Müller cells enveloping them. Regardless of the exact mechanism, the b-wave is telling us about light-induced electrical activity in retinal cells post-synaptic to the photoreceptors. The b-wave is also affected by OFF-center bipolar cells and by light-induced activity in 3rd order retinal neurons (amacrine and ganglion cells). This contribution can be isolated in the laboratory by using specific drugs but in the clinical environment, the ERG b-wave of patients reflects all contributions summed together. In the future, more sophisticated analytical approaches may allow separation of the different contributions and allow identity of more exact sites of retinal diseases.
Under special conditions of ERG recordings, the c-wave can be observed in patients. As has been discussed above, the c-wave reflects light-induced decrease in the extracellular concentration of potassium ions in the photoreceptor layer due to light-induced activity in the photoreceptors. The c-wave itself is a manifestation of the change in the trans-epithelial potential. Therefore, the c-wave can be used to assess the functional integrity of the pigment epithelial cells, the photoreceptors and the interactions between the two.
Among the minor components of the ERG, only the oscillatory potentials and the d-wave are used for clinical assessment of retinal function. The OPs are often used to assess the balance between retinal metabolic needs and retinal vascular supply, since in many retinal vascular disorders, they are the first to be affected (Yonemura and Kawasaki, 1979; Speros and Price, 1981). The d-wave is used only when the cone ON- and OFF-channels need to be separated to identify defects specific to ON-channels (Miyake et al., 1987; Alexander et al., 1992).
The other components of the ERG; the early receptor potential (ERP), scotopic threshold response (STR) and M-wave are more difficult to isolate in the routine clinical setup and are measured only for research purposes.
6. Factors affecting the ERG
In order to use the ERG in the most efficient way for retinal research and for electrodiagnosis of retinal function, the parameters that affect the ERG response need to be known.
6.1 State of adaptation:
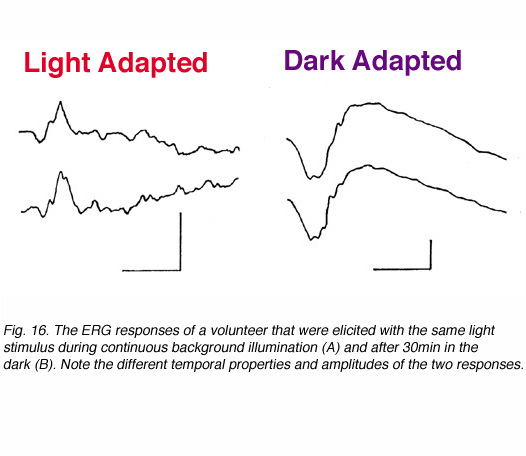
The visual system in vertebrates can be roughly divided into two subsystems; the rod system (night vision) and the cone system (day vision). Both systems operate independently with very little interactions between them. The most sensitive system under particular conditions is the one that determines vision. In some species, the rod system dominates (e.g. skate, rats) while in others the cone system is the dominant one (e.g. some fresh water turtles, ground squirrel). However, in most species including human, both systems are found. These are duplex retinas. Rod-mediated vision is very sensitive to dim light stimuli in the dark-adapted state while under background illumination, it saturates and does not respond to light increment or decrement (Hood and Finkelstein, 1986). In contrast, the cone system is not as sensitive but is characterized by the ability to adapt to bright lights: processes that allow vision to adapt to background illumination over a wide range of intensities. In order to separate cone function from rod function, we can modulate the state of adaptation as shown in figure 16. When a given light stimulus is applied under background illumination that saturates the rod system, the ERG reflects activity in the cone system. The ERG under these conditions is of small amplitude but of very fast kinetics; time to peak is about 30-32ms (Fig 16, left). In contrast, if the same light stimulus is applied after the subject is kept in darkness for about 30min, the ERG is of considerably larger amplitude (about 4 folds) and is characterized by slow temporal properties; time to peak of the b-wave is about 60ms (Fig. 16, right). This ERG response is a mixed rod-cone response (the cone system is operational too) but mainly reflects the activity in the rod system since the cone system contribution is considerably smaller.
6.2 Light intensity:
In figure 17, dark-adapted ERG responses of one volunteer are shown to light stimuli of different intensities covering a range of about 5 log units. With a dim light stimulus, the ERG is a slow positive wave of small amplitude. This is the b-wave. As the stimulus intensity is increased, the ERG b-wave increases in amplitude and becomes faster in kinetics. With yet brighter stimuli, a negative wave (the a-wave) precedes the positive b-wave. With further increase in the flash intensity, both the a-wave and the b-wave increase in amplitude and become faster. With the brightest flash used here, fast wavelets (oscillatory potentials) are seen on the rising phase of the b-wave.
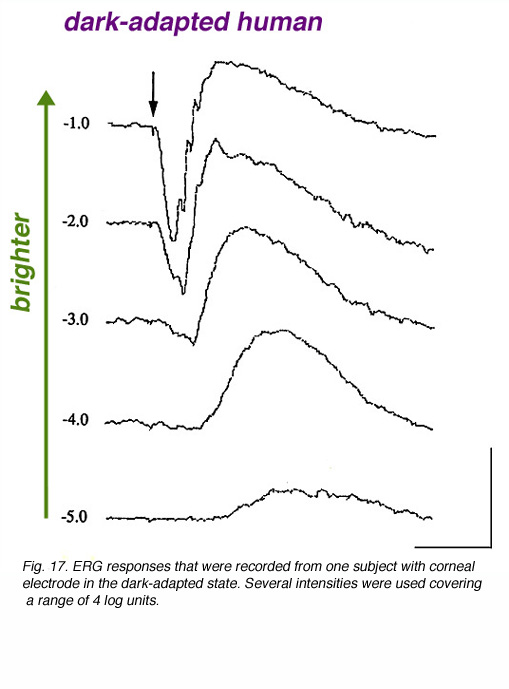
It is clear from figure 17 that the ERG responses of humans and of other vertebrate species depend upon the intensity of the light stimulus used. Therefore, it is crucial for a research laboratory as well as a clinical set-up to control the light intensity of the ERG system, and to verify that technical factors will not contaminate the data and, therefore, the conclusions. The size of the pupil is the major determinant of light intensity to the retina. A 3 fold change in pupil diameter means a 9 fold change in light intensity reaching the retina (almost 1 log unit). Opaque optical media should also be considered. Mature cataract or vitreal hemorrhage will absorb some of the impinging light and will therefore, reduce the light intensity reaching the retina. These latter factors usually absorb about 50% of the light, thereby reducing light intensity by 0.3 log units.
6.3 Color of light stimulus:
Figure 18 shows the spectral sensitivity curves of cone-mediated vision and of rod-mediated vision in human observers. The rod curve peaks at the blue-green region of the visible spectrum (around 500nm). The spectral sensitivity curve of cone-mediated vision is the sum of all three spectral types of cone; long-wavelength sensitive (red), medium-wavelength sensitive (green) and short-wavelength sensitive (blue), and, in net, has peak sensitivity in the orange range of the visible spectrum (around 560nm). Throughout most of the visible spectrum (less than 620nm), the rod system is more sensitive than the cone system by as much as 3 log units (a factor of 1000). For wavelengths longer than 620nm, the sensitivity of both systems is similar and cone vision may even exhibit a slightly higher sensitivity than rod vision.
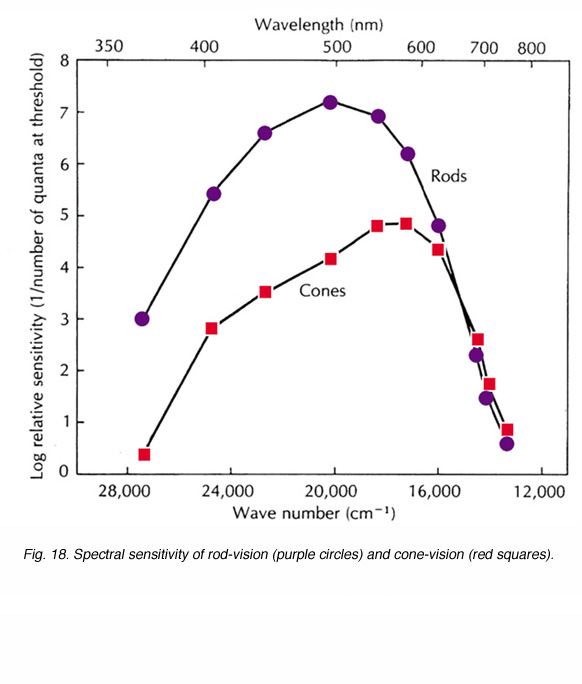
Fig. 18. Spectral sensitivity of rod-vision (purple circles) and cone-vision (red squares)
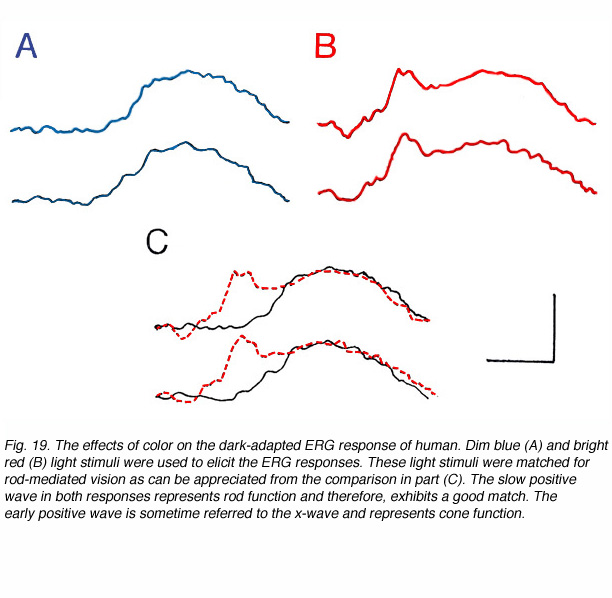
Therefore, light stimuli of different spectral content can elicit ERG responses that are dominated by one or the other systems as shown in figure 19. These ERG responses were recorded in a volunteer in the dark-adapted state using dim blue or bright red light stimuli. The blue stimulus elicits a slow positive ERG of the more sensitive rod system (A). The red light stimulus produces an ERG response composed of two parts; a fast wave peaking around 30ms and a slow wave peaking at 100ms (B). This ERG is a combination of rod and cone contributions with the cone-mediated response being of fast kinetics and the rod-mediated response of slow time-to-peak. The fast cone-mediated ERG is sometimes referred to as the x-wave (Bornschein et al., 1957; Berson and Howard, 1971). The two light stimuli were balanced to produce equal rod excitation as evidenced by the equality in the slow ERG component (Fig. 19C). With this procedure, cone-mediated function can be isolated from the large amplitude rod ERG and allows analysis of cone vs rod system in the dark-adapted state.
6.4 Frequency of photostimulation:
Another experimental approach to separate rod-mediated vision from cone-mediated vision is based upon the differences in temporal properties between these two visual systems. Measurements of critical fusion frequency (CFF), the maximal frequency of stimulation that can be perceived as flickering, show low CFF in dim illumination that rises with stimulus intensity until a plateau phase of about 15Hz is reached. Under cone vision conditions, high intensity stimuli can be perceived as flickering at frequencies of 30 and even 50Hz (Conner and MacLeod, 1976). However, when special care is taken to selectively desensitize the cones and thus, reveal the rod function under bright illumination, flicker fusion frequencies are achieved at 28Hz (Conner and MacLeod, 1976).
In ERG recording, CFF is determined by the frequency of photic stimulation that just elicits flickering electrical signal. The relationship between the ERG-determined CFF and stimulus intensity shows a discontinuity that marks the transition from rod vision to cone vision. The highest CFF for rod vision is about 15Hz while the cones can follow flickering stimulations up to 50Hz (Dodt, 1951). Recent more careful ERG recordings reveal that rod-mediated electrical activity can follow flickering frequencies higher than 15HZ, reaching as high as 28Hz (Stockman et al., 1995). It has been argued, based on recent findings on the rod system in mammals and primates, that rod signals can be transmitted via two pathways. The first one involves the rod bipolar cells. This is the slow pathway that can follow flickering stimuli up to 15Hz. The second pathway involves rod to cone gap junction that transmit rod-mediated signals via the cone bipolar cells that can follow flickering stimuli up to 28Hz (Stockman et al., 1995).
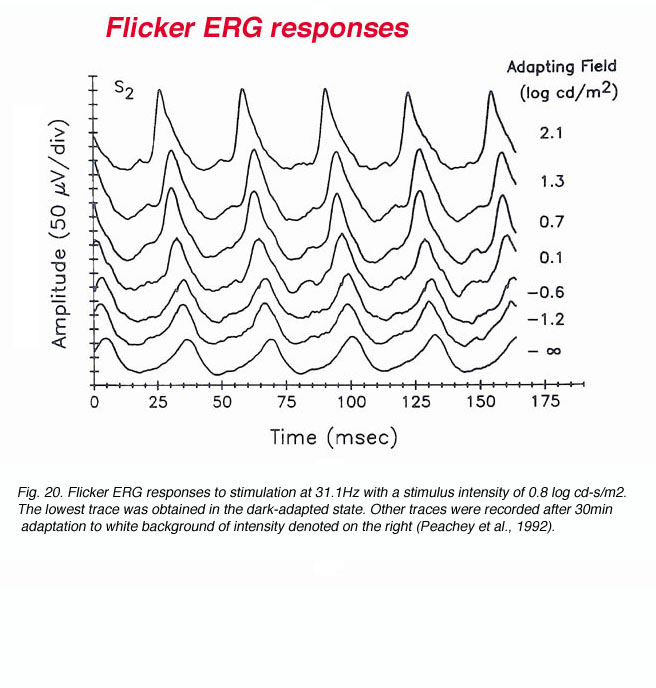
In order to reveal the fast flicker of the rod signals, special care is needed for recording conditions. Under regular recording conditions of the ophthalmic clinic, it can be accepted that rod-mediated electrical signals can follow flickering stimuli up to 15Hz. Therefore, it is customary to apply bright light stimuli at a frequency of 30Hz in order to isolate the cone system from the rod system. The responsiveness of the cone system and its ability to follow fast flickering stimuli depend upon the level of ambient illumination as shown in figure 20 (Peachey et al., 1992). In this figure, ERG recording was performed from one subject using 31.3Hz flicker of constant intensity while changing the level of ambient illumination. The responses are of larger amplitude and are characterized by faster rise times as the irradiance of the adapting field is raised. This observation is consistent with the notion that the cone system is suppressed in the dark-adapted state and that light adaptation removes this inhibitory action. However, using scotopically matched backgrounds indicates that mechanisms intrinsic to the cone system itself are also involved (Peachey et al., 1992).
7. Analysis of the ERG
Over the years, since the first recording of the ERG responses and with greater understanding of retinal function at the cellular and molecular levels, more advanced analytical approaches have been developed. In this section, the more classical means of analysis and some of the recent approaches to clinical ERG analysis will be discussed.
7.1 Amplitude and implicit time measurements:
The most common ERG response from a human, that is elicited with full field (Ganzfeld) flash of light, contains the a-wave and the b-wave as shown in figure 21. The amplitude of the a-wave is measured from a baseline that is monitored prior to the light stimulus, to the trough of the negative wave. Since the b-wave reflects the sum of the negative P-III component and the positive P-II component, its amplitude is measured from the trough of the a-wave to the peak of the b-wave. The temporal properties of the ERG response are usually defined by the time-to-peak (implicit time) of the b-wave, and are measured from stimulus onset to the peak of the b-wave (Lb in Fig. 21). In some laboratories the time-to-peak of the a-wave is also measured (La in Fig. 21). These ERG parameters change with intensity of the light stimulus (Fig. 17) and with the state of adaptation (Fig. 16) as we have seen earlier.
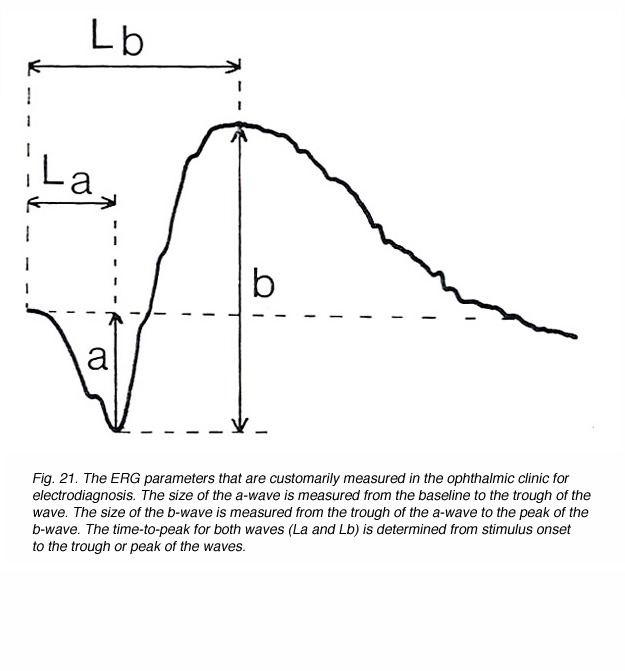
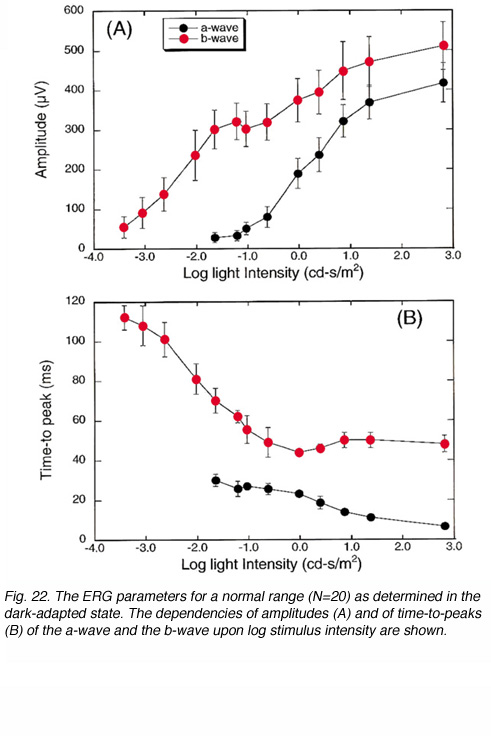
Figure 22 shows the dependency of the ERG amplitudes and temporal properties upon stimulus intensity (A and B respectively). These curves were constructed from ERG measurements in 20 volunteers with no visual defects and were conducted in the dark-adapted state. Data represent average (+/- s.d.) of the amplitude and time-to-peak of the a-wave and the b-wave. For dim light stimuli, the ERG consists of only the b-wave (Fig. 22A). As stimulus intensity is increased, the b-wave increases in amplitude until a plateau is reached at intensities brighter by about 2 log units than that needed to elicit the smallest recordable b-wave. At these intensities, the a-wave, becomes evident. With further increases in intensity, both a- and b-waves grow in amplitude. The effect of stimulus intensity upon the kinetics of the ERG response is clearly seen in the dependency of the a- and b-wave time-to-peaks upon stimulus intensity (Fig. 22B). The brighter the flash stimulus the faster the ERG response, and the shorter the time-to-peaks of both waves are. This type of analysis can give valuable information about retinal function in a clinical setup where all conditions of measurements are maintained at a constant.
The relationship between amplitude and intensity of the ERG waves can be described by the following hyperbolic function (Fulton and Rushton, 1978; Hood and Birch, 1992).
V/Vmax = I/(I + s) (Equation 1)
In this equation, V and Vmax are the amplitudes that are measured with light stimulus of intensity I and with super-saturating stimulus respectively. The parameter s is the semi-saturation constant and is the stimulus intensity needed to elicit a response of half maximal amplitude. This parameter also describes the location of the intensity-response curve along the intensity axis. When very dim light stimuli are used (I < s), eq. (1) can be reduced to
V/Vmax = I/s (Equation 2)
Namely, the amplitude V is linearly related to the light intensity I with a slope of Vmax/s. Thus, the semi-saturation constant is also used as a measure of sensitivity.
The values Vmax and s have been calculated for normal subjects under different conditions in order to study retinal mechanisms during adaptation or development (Fulton and Rushton, 1978; Fulton and Hansen, 1982, 1988; Peachey et al., 1989). In patients, these parameters provide quantitative assessment of retinal function during the progress of retinal diseases and the success of treatment (Arden et al., 1983; Massof et al., 1984). Furthermore, these parameters indicate the nature of the disease; progressive or static, affecting the entire retina or only patches and the site of the disorder (Arden et al., 1983; Fulton and Hansen, 1988; Johnson and Hood, 1988; Hood, 1990).
7.2 Ratio of b-wave to a-wave:
ERG analysis that is based only upon amplitude measurements may lead to erroneous conclusions if the pupil is not maximally dilated. Furthermore, exchange of information between laboratories that use different recordings conditions has always been problematical. One way to circumvent this difficulty is to compare a series of ERG responses for the relationship between the a-wave and the b-wave (Perlman, 1983). This analysis is based upon our understanding of retinal physiology and the origin of the ERG waves. If the a-wave reflects activity in the photoreceptors and the b-wave originates from post-synaptic neurons, than normal signal transmission in the distal retina will be expressed in normal relationship between the b-wave and the a-wave. Such analysis can also be used to compare ERG data between laboratories as shown in figure 23. The figure was constructed from ERG data of 20 volunteers with normal vision who were tested in the dark-adapted state with light stimuli of different intensities. The relationship between the b- and a-waves was derived for each subject and the normal mean (continuous line) and range (+/- s.d., dashed lines) are shown in the figure. ERG data from two other laboratories that use different corneal electrodes and different light sources are shown (red dots, blue triangles). The data points from these laboratories fall within our normal range indicating normal retinal function.

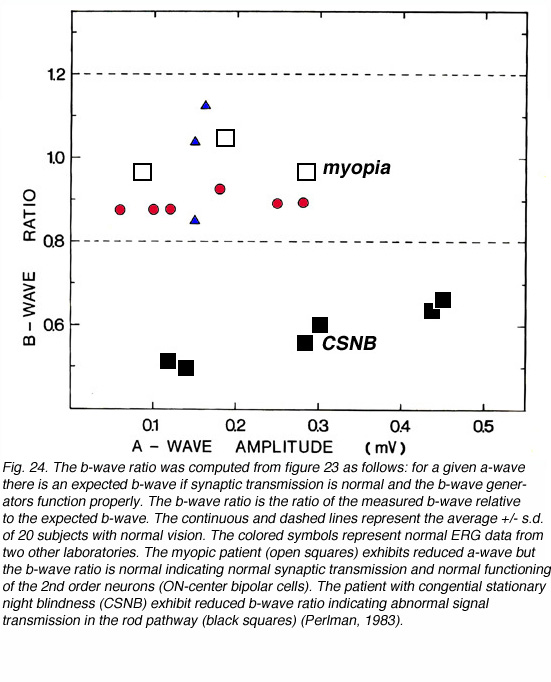
This type of analysis can also help in understanding the site of disorder. Any disorder that is localized to the photoreceptors and does not involve more proximal sites will be expressed in abnormal a-wave amplitude but normal b-wave to a-wave ratio. In contrast, a defect in signal transmission in the outer plexiform layer will show abnormal b-wave to a-wave ratio but the amplitudes of the ERG waves may even increase. This is illustrated in figure 24 for two cases. In this figure, the b-wave to a-wave ratio is plotted in a different manner. The a-wave is used as the independent variable and is used together with the normal b-wave to a-wave ratio (of Fig. 23) to derive the expected b-wave. Then, the ratio of the measured b-wave to the expected b-wave tells us about signal transmission in the OPL. In figure 24, the mean (+/- s.d) of the b-wave ratios for 20 volunteers with normal vision is plotted as a function of the a-wave amplitude. The data from normal subjects that were recorded in another two laboratories (red and blue symbols) fall well within the normal range of my laboratory. The b-wave ratios of a patient with high myopia and of a patient suffering from congenital stationary night blindness (CSNB) are compared to the normal range. The patient with high myopia is characterized by subnormal ERG responses due to the reduced function of the photoreceptors. However, the b-wave ratio is normal indicating normal signal transmission. The CSNB patient is characterized by subnormal b-wave ratio in agreement with the known defect in synaptic transmission from rods to bipolar cells.
7.3 Reconstruction of P-III:
For over 50 years, since the analysis by Granit (1933) of the ERG components, the a-wave has been used to assess the functional integrity of the photoreceptors. Extracellular recordings of the photoreceptors currents (Penn and Hagins, 1972) and the introduction of the suction electrode technique to record the photocurrents from individual photoreceptors (Baylor et al., 1984) allows creation of a mathematical model to fit to the ERG a-wave. This describes the entire contribution of the photoreceptors to the ERG – the P-III component (Hood and Birch, 1990, 1995). The model is based upon the two-component model of the light-induced currents of mammalian rods (Baylor et al., 1984; Lamb and Pugh, 1992; Pugh and Lamb, 1993) and is given by the following equation
P3(i, t) = {1 – exp[-iS(t – td)2]}RmP3 (Equation 3)
In this equation, P3, the amplitude of Granit’s P-III component, is a function of flash energy i and time of measurement t after light onset. S is a sensitivity parameter, RmP3 is the maximum amplitude of P-III and td is a delay.
In order to derive the relationship between P3 and time for the entire ERG range, very bright flashes that saturate the photoreceptors (i.e. shut down the ‘dark’ current completely) are needed (Fig. 25A). As can be seen in these ERG records, the a-wave saturates for the 2 brightest light stimuli. Time of analysis is limited to the period before b-wave intrusion, as shown by the two dashed vertical lines (Fig. 25A). Application of eq. (3) to these ERG data is shown in figure 25B. The data points are the amplitude measurements of the ERG responses and the continuous curves are the fitted model. The fit of the theoretical curves to the actual data is quite good for the first 25ms of the ERG responses. Longer intervals cannot be compared because the positive P-II component starts to develop and to affect the ERG recordings.
The bright-flash ERG response predominantly reflects rod function with small contribution of the cone photoreceptors. In order to derive the isolated rod P-III wave and allow analysis of rod function alone, a procedure for rod-isolating technique has been suggested (Hood and Birch, 1990). ERG responses are also elicited by long-wavelength light stimuli (greater than 605nm). These responses reflect mainly cone contribution and can be subtracted from the responses to white light stimuli and thus isolate the rod ERG responses.

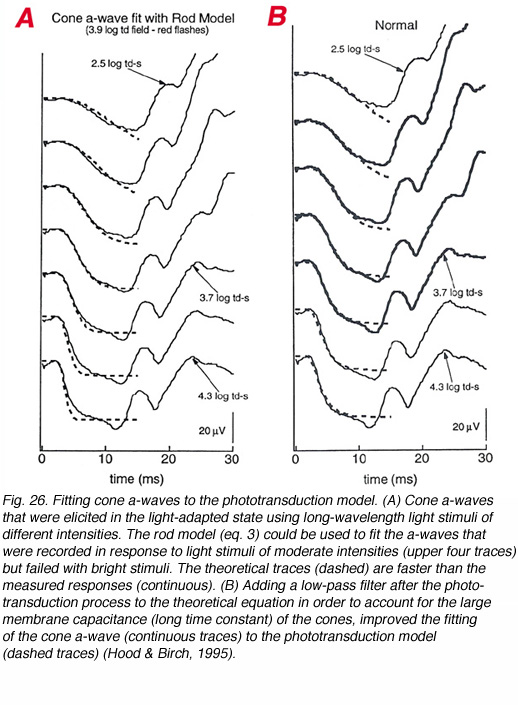
A model, similar to that suggested for the rod P-III, has also been suggested for the cone P-III (Hood and Birch, 1993, 1995). However, in order to construct the cone P-III from the a-wave of the bright flash photopic ERG response, a low-pass, exponential filter needs to be added, following the phototransduction process (Hood and Birch, 1995). This filter represents membrane capacitance that determines the rate at which the photocurrent is translated into membrane potential. With the rods the membrane capacitance is relatively small and therefore, the development of membrane potential follows quite accurately the development of photocurrent. This is not true for the cone photoreceptors probably due to the infoldings of the plasma membrane that make the outer segment discs and contribute to membrane capacitance. The importance of adding this low-pass filter to fit the phototransduction model to the cone a-wave is illustrated in figure 26. The ERG responses were elicited by a series of red light stimuli of moderate to bright intensities that were applied during background illumination. When the rod model (eq. 3) was fitted to the cone a-wave (Fig. 26A), a substantial discrepancy between the theoretical curves and measured ones was seen (dashed and continuous curves respectively). However, when a low-pass filter with t = 1.8ms was added, a good fit was obtained between the theoretical and measured responses (Fig. 26B, dashed and continuous traces respectively).
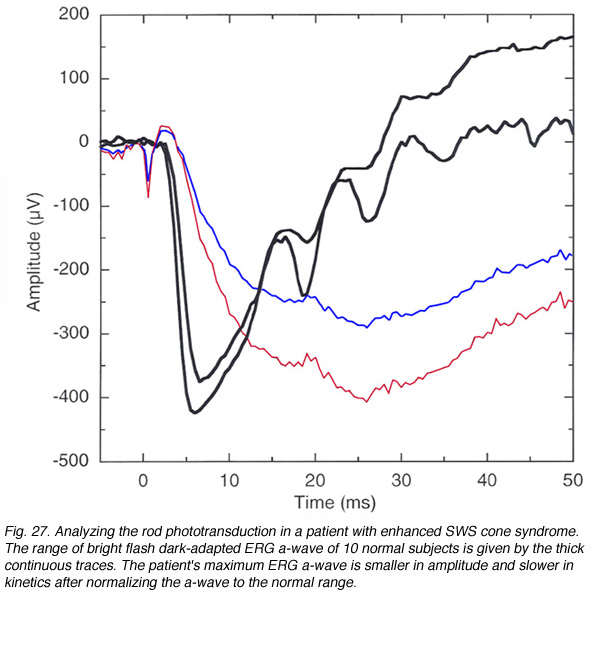
The model discussed above, or an extension of it using bright light stimuli to elicit ERG responses (Cideciyan and Jacobson, 1996), can be used to analyze biophysical mechanisms of the phototransduction process. These can be used for research purposes to study non-invasibly and in a chronic manner, photoreceptor function in primates (Jamison et al., 2001), or to analyze the disorder locus in patients with retinal diseases (Hood and Birch, 1994a, 1997). By fitting rod a-waves to the phototransduction model (eq. 3), it is possible to isolate disorders that affect the sensitivity of the rods, from disorders that affect their maximum response. A more simple approach is to record the ERG to bright white flash and compare the patient ERG to the normal range. A disease that leads to a reduction in the maximum response (RmP3), will show as a smaller maximum a-wave in the ERG that can be scaled up to fit the normal one. In contrast, a disorder that affects the sensitivity (S) will cause a smaller or even normal amplitude a-wave, but when scaled to the normal one, a delay in its development will be seen (Hood and Birch, 1997). An example is shown in figure 27. The thick continuous traces show the range of a-waves that were recorded from 10 volunteers with normal vision in the dark-adapted state using a white light stimulus of 664 cd-s/m2. The colored traces are the actual ERG responses of a patient who was diagnosed with enhanced short-wavelength cone syndrome (enhanced SWS cones). His dark-adapted a-wave is smaller in amplitude than that of the normal range and when scaled up exhibits considerably slower kinetics. Thus, the dark-adapted a-wave of this patient is characterized by smaller maximum response and reduced sensitivity. This patient also complained of difficulty at night and had an abnormal dark-adaptation curve with only cone adaptation and no rod function (Perlman et al., 1993).
7.4 Reconstruction of P-II:
Granit’s P-II component is generated in the neural retina mainly by ON-center bipolar cells with minor contributions from OFF-center bipolar cells and 3rd order neurons. Accurate measurement of the P-II amplitude can supply valuable information to the clinician on the functional integrity of the retina. However, the b-wave of the ERG is the sum of the positive P-II and the negative P-III. Therefore, changes in the b-wave can reflect changes in either of these components. The best estimate of the b-wave is by measuring it from the trough of the a-wave to the peak of the b-wave, however this method will always underestimate the amplitude of P-II. Furthermore, the temporal properties of P-II are of value to the clinician. However, the time-to-peak of the ERG b-wave is not the time-to peak of the isolated P-II component but rather depends upon the summation of P-II and P-III (Hood and Birch, 1992).
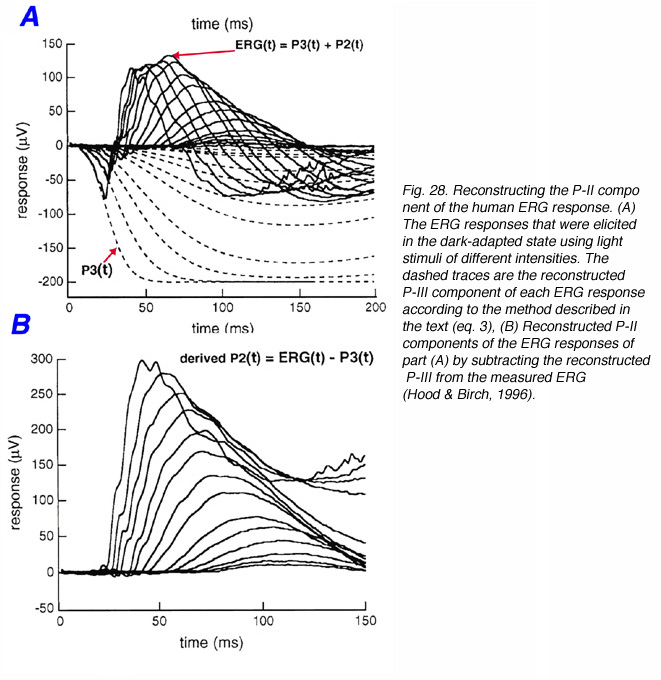
Since the ERG P-III component can be reconstructed from bright flash ERG responses using the phototransduction model (eq. 3), P-II can be estimated for any stimulus intensity by subtracting the estimated P-III from the measured ERG (Fig. 28) (Hood and Birch, 1992). Dark-adapted ERG responses of a normal subject were elicited by a standard series of light stimuli (Fig. 28A). The dashed traces are the theoretical rod responses that were derived from bright flash responses as described above (section 7.3). By subtracting the rod responses from the measured ERG responses, the P-II components can be isolated (Fig. 28B). From this set of data, the actual amplitude and time-to-peak of the ERG P-II component can be obtained and used to understand retinal changes (Hood et al., 1994b).
7.5 Paired-flash analysis of the rod response:
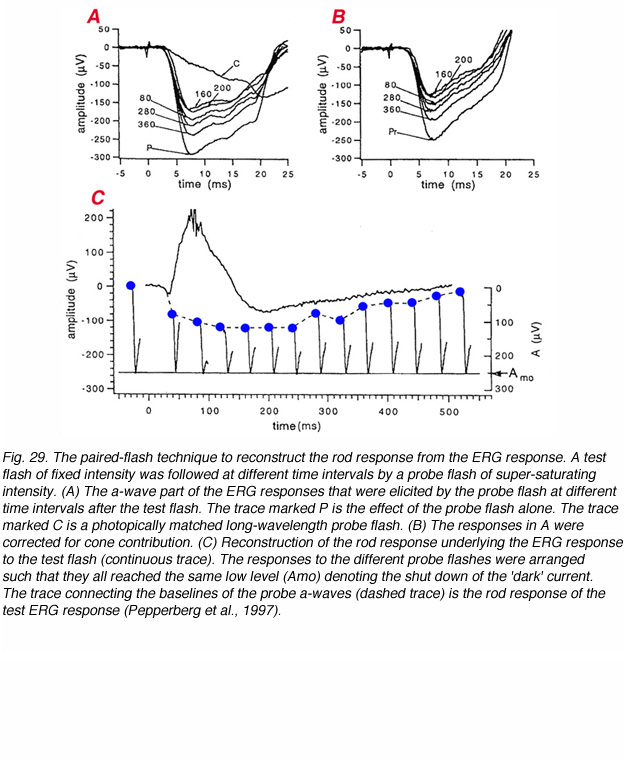
A test flash of fixed intensity induces a rod response that reflects the degree to which the ‘dark’ current is reduced, and the time course of closure, followed by opening, of the cGMP-gated channels. This rod response underlies the receptor component (P-III) of the ERG. It is normally masked throughout most of its period by the large positive b-wave. The paired-flash technique has been developed to reconstruct the P-III component (Pepperberg et al., 1997; Hetling and Pepperberg, 1999). The concept of the paired-flash approach is that a super-bright flash delivered after a test flash will completely shut down the remaining ‘dark’ current, and therefore, the amplitude of the a-wave, which is elicited by the probe flash, can be used as a measure of the prevailing rod ‘dark’ current at that time. Thus, two stimuli are applied at variable time intervals. A test flash of fixed intensity (Itest) that is given at t=0 and a bright probe flash (Iprobe) that is expected to shut down the ‘dark’ current and is delivered at variable time interval, tprobe, after the test flash. For long time intervals, the a-wave of the probe flash will be large and constant, since the rods have recovered from the effects of the test flash, and the probe flash induces an a-wave of saturating amplitude. However, with short inter-flash intervals, the probe flash can only shut down the ‘dark’ current that exists at that time, and therefore, the amplitude of the a-wave will be smaller. Such an experiment is illustrated in figure 29. The a-waves elicited by probe flashes at different time intervals after the test flash are shown in figure 29A. The shorter the inter-flash interval, the smaller the a-wave that is elicited by the probe flash. These a-waves are corrected for cone contributions in figure 29B. Figure 29C illustrates the construction of the rod response underlying the test flash. The a-waves elicited by the probe flashes are arranged according to their inter-flash interval so that all their peaks reach the same level – the level where all the ‘dark’ current is shut off. Connecting the baselines of the probe a-waves gives the time course of the rod response of the test flash.
8. References
Alexander KR, Fishman GA, Peachey NS, Marchese AL, Tso MOM. ‘ON’ response defect in paraneoplastic night blindness with cutaneous maliganant melanoma.Invest Ophthalmol Vis Sci. 1992;33:477–483. [PubMed]
Arden, G. B. & Brown, K. T. (1965). Some properties of components of the cat electroretinogram revealed by local recordings under oil. Journal of Physiology (London) 176, 429-461.
Arden GB, Carter RM, Hogg CR, Powell DJ, Ernst WJK, Clover GM, Lyness AL, Quinlan MP. A modified ERG technique and the results obtained for X-linked retinitis pigmentosa. Br J Ophthalmol. 1983;67:419–430. [PubMed] [Free Full text in PMC]
Armington JC. The electroretinogram. New York: Academic Press. 1974
Asi H, Perlman I. Relationships between the electroretinogram a-wave, b-wave and oscillatory potentials and their application to clinical diagnosis. Doc Ophthalmol. 1992;79:125–139. [PubMed]
Awatramani G, Wang J, Slaughter MM. Amacrine and ganglion cell contributions to the electroretinogram in amphibian retina. Vis Neurosci. 2001;18:147–156.[PubMed]
Baylor DA, Nunn BJ, Schnapf JL. The photocurrent, noise and spectral sensitivity of rods of monkey Macaca fascicularis. J Physiol. 1984;357:575–607.[PubMed] [Free Full text in PMC]
Berson EL, Goldstein EB. The early receptor potential in dominantly inherited retinitis pigmentosa. Arch Ophthalmol. 1970a;83:412–420. [PubMed]
Berson EL, Goldstein EB. The early receptor potential in sex-linked retinitis pigmentosa. Invest Ophthalmol. 1970b;9:58–63. [PubMed]
Berson EL, Howard J. Temporal aspects of the electroretinogram in sector retinitis pigmentosa. Arch Ophthalmol. 1971;86:653–665. [PubMed]
Bornschein H, Goodman G, Gunkel RD. Temporal aspects of the human electroretinogram; a study of the implicit time-amplitude relationship of the b-wave. AMA Arch Ophthalmol. 1957;57:386–392. [PubMed]
Bresnick GH, Palta M. Oscillatory potential amplitude. Relation to severity of diabetic retinopathy. Arch Ophthalmol. 1987;105:929–933. [PubMed]
Brindley GS. The passive electrical properties of the frog’s retina, choroid and sclera for radial fields and currents. J Physiol. 1956;134:339–352. [PubMed]
Brindley GS, Hamasaki DI. The properties and nature of the R membrane of the frog’s eye. J Physiol. 1963;167:599–606. [PubMed]
Brown KT, Wiesel TN. Analysis of the intra retinal electroretinogram in the intact cat eye. J Physiol. 1961a;158:229–256. [PubMed]
Brown KT, Wiesel TN. Localization of origins of electroretinogram components by intra retinal recording in the intact cat eye. J Physiol. 1961b;158:257–280.[PubMed]
Brown KT, Watanabe K. Isolation and identification of a receptor potential from the pure cone fovea of the monkey retina. Nature. 1962;193:958–960. [PubMed]
Brown KT, Murakami M. A new receptor potential of the monkey retina with no detectable latency. Nature. 1964a;201:626–628. [PubMed]
Brown KT, Murakami M. Biphasic form of the early receptor potential of the monkey retina. Nature. 1964b;204:739–740. [PubMed]
Brown KT, Watanabe K, Murakami M. The early and late receptor potential of monkey cones and rods. Cold Spring Harb Symp Quant Biol. 1965;30:457–482.[PubMed]
Brown KT. The electroretinogram: its components and their origin. Vision Res. 1968;8:633–677. [PubMed]
Byzov AL. Localization of the R-membrane in the frogeye by means of an electrode marking method. Vision Res. 1968;8:697–700. [PubMed]
Cideciyan AV, Jacobson SG. An alternative photo transduction model for human rod and cone ERG a-wave: normal parameters and variation with age. Vision Res. 1996;36:2609–2621. [PubMed]
Cone RA. Early receptor potential of the vertebrate retina. Nature. 1964;204:736–739. [PubMed]
Conner JD, MacLeod DI. Rod photoreceptors detect rapid flicker. Science. 1977;195:698–699. [PubMed]
Dick E, Miller RF. Extracellular K+ activity changes related to electroretinogram components. I. Amphibian (I-type) retinas. J Gen Physiol. 1985;85:885–909.[PubMed]
Dick E, Miller RF, Bloomfield S. Extracellular K+ activity changes related to electroretinogram components. II. Rabbit (E-type) retinas. J Gen Physiol. 1985;85:911–931. [PubMed]
Dodt E. Cone electroretinography by flicker. Nature. 1951;168:738. [PubMed]
Dong CJ, Hare WA. Contribution to the kinetics and amplitude of the electroretinogram b-wave by third-order retinal neurons in the rabbit retina. Vision Res.2000;40:579–589. [PubMed]
Dong CJ, Hare WA. GABAC feedback pathway modulates the amplitude and kinetics of ERG b-wave in a mammalian retina in vivo. Vision Res. 2002;42:1081–1087. [PubMed]
Doslak MJ, Plonsey R, Thomas CW. The effects of variations of the conducting media in homogeneities on the electroretinogram. IEEE Trans Biomed Eng.1980;27:88–94. [PubMed]
Doslak MJ. A theoretical study of the effect of silicone oil on the electroretinogram. Invest Ophthalmol Vis Sci. 1988;29:1881–1884. [PubMed]
Einthoven W, Jolly WA. The form and magnitude of the electrical response of the eye to stimulation by light at various intensities. Q J Exp Physiol. 1908;1:373–416.
Faber DS. Analysis of the slow trans-retinal potentials in response to light. Buffalo (NY): State University of New York. 1969
Finkelstein D, Gouras P, Hoff M. Human electroretinogram near the absolute threshold of vision. Invest Ophthalmol. 1968;7:214–218. [PubMed]
Foerster MH, Esser J, Laqua H. Silicone oil and its influence on electrophysiologic findings. Am J Ophthalmol. 1985;99:201–206. [PubMed]
Frishman LJ, Steinberg RH. Light-evoked changes in [K+]o in proximal portion of dark-adapted cat retina. J Neurophysiol. 1989b;61:1233–1243. [PubMed]
Frishman LJ, Yamamoto F, Bogucka I, Steinberg RN. Light-evoked changes in [K+]o in proximal portion of light-adapted retina. J Neurophysiol. 1992;67:1201–1212. [PubMed]
Frost-Larsen K, Larsen HW, Simonsen SE. Oscillatory potential and nyctometry in insulin-dependent diabetics. Acta Ophthalmol (Copenh). 1980;58:879–888.[PubMed]
Fulton AB, Rushton WAH. The human rod ERG: correlation with psychophysical responses in light and dark adaptation. Vision Res. 1978;18:793–800.[PubMed]
Fulton AB, Hansen RM. Background adaptation in human infants: analysis of b-wave responses. Doc Ophthalmol. 1982;31:191–197.
Fulton AB, Hansen RM. Scotopic stimulus/response relations of the b-wave of the electroretinogram. Doc Ophthalmol. 1988;68:293–304. [PubMed]
Furukawa T, Hanawa I. Effects of some common cations on electroretinogram of the toad. Jpn J Physiol. 1955;5:289–300. [PubMed]
Gotch F. The time relations of the photoelectric changes on the eyeball of the frog. J Physiol. 1903;29:388–416. [PubMed]
Gouras P. Electrical activity of toad retina. Am J Ophthalmol. 1958;46:59–72. [PubMed]
Granit R. The components of the retinal action potential in mammals and their relation to the discharge in the optic nerve. J Physiol. 1933;77:207–239. [PubMed]
Green DG, Kapousta-Bruneau NV. A dissection of the electroretinogram from the isolated rat retina with microelectrode and drugs. Vis Neurosci. 1999;16:727–741. [PubMed]
Gurevich L, Slaughter MM. Comparison of the waveforms of the ON bipolar neuron and the b-wave of the electroretinogram. Vision Res. 1993;33:2431–2435.[PubMed]
Hetling JR, Pepperberg DR. Sensitivity and kinetics of mouse rod flash responses determined in vivo from paired-flash electroretinograms. J Physiol.1999;516:593–609. [PubMed]
Heynen H, van Norren D. Origin of the electroretinogram in the intact macaque eye. I. Principal compound analysis. Vision Res. 1985a;25:697–707. [PubMed]
Heynen H, van Norren D. Origin of the electroretinogram in the intact macaque eye. II. Current source-density analysis. Vision Res. 1985b;25:709–715. [PubMed]
Heynen H, Wachtmeister L, van Norren D. Origin of the oscillatory potentials in the primate retina. Vision Res. 1985;25:1365–1373. [PubMed]
Hodgkin AL, O’Bryan P. Internal recordings of the early receptor potential in turtle retina. J Physiol. 1977;267:737–766. [PubMed] [Free Full text in PMC]
Hood DC, Finkelstein MA. Sensitivity to light. In: Boff KR, Kaufman L, Thomas JP, editors. Handbook of perception and human performance. Vol 1: Sensory processes and perception. New York: John Wiley and Sons; 1986. p. 1–66.
Hood DC. The ERG and sites and mechanisms of retinal disease, adaptation, and development. In: Advances in photoreception. Washington (DC): National Academy Press; 1990. p. 41–58.
Hood DC, Birch DG. Aquantitative measure of the electrical activity of human rod photoreceptors using electroretinography. Vis Neurosci. 1990;5:379–387.[PubMed]
Hood DC, Birch DG. A computational model of the amplitude and implicit time of the b-wave of the human ERG. Vis Neurosci. 1992;8:107–126. [PubMed]
Hood DC, Birch DG. Human cone receptor activity: the leading edge of the a-wave and models of receptors activity. Vis Neurosci. 1993;10:857–871. [PubMed]
Hood DC, Birch DG. Rod phototransduction in retinitis pigmentosa: estimation of parameters derived from the rod a-wave. Invest Ophthalmol Vis Sci.1994a;35:2948–2961. [PubMed]
Hood DC, Shady S, Birch DG. Understanding changes in the b-wave of the ERG caused by heterogenous receptor damage. Invest Ophthalmol Vis Sci.1994b;35:2477–2488. [PubMed]
Hood DC, Birch DG. Phototransduction in human cones measured using the a-wave of the ERG. Vision Res. 1995;35:2801–2810. [PubMed]
Hood DC, Birch DG. beta wave of the scotopic (rod) electroretinogram as a measure of the activity of human on-bipolar cells. J Opt Soc Am A Opt Image Sci Vis.1996;13:623–633. [PubMed]
Hood DC, Birch DG. Assessing abnormal rod photoreceptor activity with the a-wave of the electroretinogram: applications and methods. Doc Ophthalmol. 1996-1997;92:253–267. [PubMed]
Jamison JA, Bush RA, Lei B, Sieving P. Characterization of the rod photoresponse isolated from the dark-adapted primate ERG. Vis Neurosci. 2001;18:445–455. [PubMed]
Johnson MA, Hood DC. A theoretical interpretation of ERG abnormalities in central retinal vein occlusion. Opt Soc Am Tech Dig. 1988;3:84–87.
Kapousta-Bruneau NV. Opposite effects of GABAA and GABAC receptor antagonists on the b-wave of ERG recorded from the isolated rat retina. Vision Res.2000;40:1653–1665. [PubMed]
Karowski CJ, Proenza LM. Relationship between Müller cell responses, a local transretinal potential and potassium flux. J Neurophysiol. 1977;40:244–259.[PubMed]
Karwoski CJ, Proenza LM. Neurons, potasium and glia in proximal retina of Necturus. J Gen Physiol. 1980;75:141–162. [PubMed]
Karwoski CJ, Newman EA, Shimazaki H, Proenza LM. Light-evoked increases in extracellular K+ in the plexiform layers of amphibian retinas. J Gen Physiol.1985;86:189–213. [PubMed]
Karwoski CJ, Lu H-K, Newman EA. Spatial buffering of light-evoked potassium increases by Müller (glia) cells. Science. 1989;244:578–580. [PubMed]
Karwoski CJ, Xu X. Current source-density analysis of light-evoked field potentials in rabbit retina. Vis Neurosci. 1999;16:369–377. [PubMed]
Kline RP, Ripps H, Dowling JE. Generation of b-wave currents in the skate retina. Proc Natl Acad Sci U S A. 1978;75:5727–5731. [PubMed] [Free Full text in PMC]
Kline RP, Ripps H, Dowling JE. Light-induced potassium fluxes in the skate retina. Neuroscience. 1985;14:225–235. [PubMed]
Knave B, Moller A, Persson HE. A component analysis of the electroretinogram. Vision Res. 1972;12:1669–1684. [PubMed]
Lamb TD, Pugh EN. A quantitative account of the activation steps involved in phototransduction in amphibian photoreceptors. J Physiol. 1992;449:719–758.[PubMed] [Free Full text in PMC]
Lei B, Perlman I. The contribution of voltage- and time-dependent poassium conductances to the electroretinogram in rabbits. Vis Neurosci. 1999;16:743–754.[PubMed]
Linn DM, Solessio E, Perlman I, Lasater EM. The role of potassium conductance in the generation of light responses in Müller cells of the turtle retina. Vis Neurosci. 1998;15:449–458. [PubMed]
Massof RW, Wu L, Finkelstein D, Perry C, Starr SJ, Johnson MA. Properties of electroretinographic intensity-response functions in retinitis pigmentosa. Doc Ophthalmol. 1984;57:279–296. [PubMed]
Masu M, Iwakabe H, Tagawa Y, Miyoshi T, Yamashita M, Fukuda Y, Sasaki H, Hiroi K, Nakamura Y, Shigemoto R, Takada M, Nakamura K, Nakao K, Katsuki M, Nakanishi S. Specific deficit of the ON response in visual transmission by targeted disruption of the mGluR6 gene. Cell. 1995;80:757–765. [PubMed]
Miller RF, Dowling JE. Intracellular responses of the Müller (glial) cells of the mudpuppy retina: their relation to the b-wave of the electroretinogram. J Neurophysiol.1970;33:323–341. [PubMed]
Miller RF. Role of K+ in generation of b-wave of electroretinogram. J Neurophysiol. 1973;36:28–35. [PubMed]
Miyake Y, Yagasaki K, Horiguchi M, Kawase Y. On- and off-responses in photopic electroretinogram in complete and incomplete types of congenital stationary night blindness. Jpn J Ophthalmol. 1987;31:81–87. [PubMed]
Murakami M, Kaneko A. Sub components of P3 in cold-blooded vertebrate retinae. Nature. 1966;210:103–104. [PubMed]
Murakami M, Pak WL. Intracellularly recorded early receptor potential of the vertebrate photoreceptors. Vision Res. 1970;10:965–975. [PubMed]
Newman EA. Current source-density analysis of the b-wave of frog retina. J Neurophysiol. 1980;43:1355–1366. [PubMed]
Newman EA, Odette LL. Model of electroretinogram b-wave generation: a test of the K+ hypothesis. J Neurophysiol. 1984;51:164–182. [PubMed]
Newman EA. Potassium conductance block by barium in amphibian Müller cells. Brain Res. 1989;498:308–314. [PubMed]
Nilsson SEG. Human retinal vascular obstructions. A quantitative correlation of angiographic and electroretinographic findings. Acta Ophthalmol (Copenh).1971;49:111–133. [PubMed]
Noell WK. The origin of the electroretinogram. Am J Ophthalmol. 1954;38:78–90. [PubMed]
Oakley B, Green DG. Correlation of light-induced changes in retinal extracellular potassium concentration with c-wave of the electroretinogram. J Neurophysiol.1976;39:1117–1133. [PubMed]
Oakley B. Potassium and the photoreceptor-dependent pigment epithelium hyperpolarization. J Gen Physiol. 1977;70:405–425. [PubMed]
Ogden TE, Ito H. Avian retina. II. An evaluation of retinal electrical anisotropy. J Neurophysiol. 1971;34:367–373. [PubMed]
Ogden TE. The oscillatory waves of the primate electroretinogram. Vision Res. 1973;13:1059–1074. [PubMed]
Peachey NS, Alexander KR, Fishman GA. The luminance-response function of the dark-adapted human electroretinogram. Vision Res. 1989;29:263–270.[PubMed]
Peachey NS, Alexander KR, Derlacki DJ, Fishman GA. Light adaptation, rods, and the human cone flicker ERG. Vis Neurosci. 1992;8:145–150. [PubMed]
Penn RD, Hagins WA. Signal transmission along retinal rods and the origin of the electroretinographic a-wave. Nature. 1969;223:201–205. [PubMed]
Penn RD, Hagins WA. Kinetics of the photocurrent of retinal rods. Biophys J. 1972;12:1073–1094. [PubMed] [Free Full text in PMC]
Pepperberg DR, Brown PK, Lurie M, Dowling JE. Visual pigment and photoreceptor sensitivity in the isolated skate retina. J Gen Physiol. 1978;71:369–396.[PubMed]
Pepperberg DR, Masland RH. Retina-induced sensitization of light-adapted rabbit retina. Brain Res. 1978;151:194–200. [PubMed]
Pepperberg DR, Birch DG, Hood DC. Photoresponses of human rods in vivo derived from paired-flash electroretinograms. Vis Neurosci. 1997;14:73–82.[PubMed]
Perlman I. Relationship between the amplitudes of the b wave and the a wave as a useful index for evaluating the electroretinogram. Br J Ophthalmol.1983;67:443–448. [PubMed] [Free Full text in PMC]
Perlman I, Leibu R, Barth J. Night blindness: a new type with abnormal properties of the electroretinogram. Clin Vis Sci. 1993;8:159–169.
Pugh EN, Lamb TD. Amplification and kinetics of the activation steps in phototransduction. Biochim Biophys Acta. 1993;1141:111–149. [PubMed]
Reichelt W, Pannicke T. Voltage-dependent K+ currents in guinea pig Müller (glial) cells show different sensitivities to blockade by Ba2+ Neurosci Lett.1993;155:15–18. [PubMed]
Ripps H, Witkovsky P. Neuron-glia interaction in the brain and retina. In: Osborne N, Chader G, editors. Progress in retinal research. Vol. 4. Pergamon Press; 1985. p. 181–219.
Rodieck RW. . The vertebrate retina: principles of structure and function. San Francisco: W.H. Freeman. 1973
Sieving PA, Frishman LJ, Steinberg RH. Scotopic threshold response of proximal retina in cat. J Neurophysiol. 1986a;56:1049–1061. [PubMed]
Sieving PA, Frishman LJ, Steinberg RH. M-wave of proximal retina in cat. J Neurophysiol. 1986b;56:1039–1048. [PubMed]
Sieving PA, Nino C. Scotopic threshold response (STR) of the human electroretinogram. Invest Ophthalmol Vis Sci. 1988;29:1608–1614. [PubMed]
Sieving PA, Murayama K, Naarendorp F. Push-pull model of the primate photopic electroretinogram: a role for hyperpolarizing neurons in shaping the b-wave. Vis Neurosci. 1994;11:519–532. [PubMed]
Sillman AJ, Ito H, Tomita T. Studies on the mass receptor potential of the isolated frog retina. I. General properties of the response. Vision Res. 1969a;9:1435–1442. [PubMed]
Sillman AJ, Ito H, Tomita T. Studies on the mass receptor potential of the isolated frog retina. II. On the basis of the ionic mechanism. Vision Res. 1969b;9:1443–1451. [PubMed]
Simonsen SE. The value of the oscillatory potential in selecting juvenile diabetics at risks of developing proliferative diabetic retinopathy. Acta Ophthalmol (Copenh). 1980;58:865–877. [PubMed]
Slaughter MM, Miller RF. 2-Amino-4-phosphonobutyric acid: a new pharmachological tool for retinal research. Science. 1981;211:182–185. [PubMed]
Speros P, Price J. Oscillatory potentials: history, techniques and potential use in the evaluation of disturbances of retinal circulation. Surv Ophthalmol.1981;25:237–252. [PubMed]
Steinberg RH, Schmidt R, Brown KT. Intracellular responses to light from cat pigment epithelium: origin of the electroretinogram c-wave. Nature. 1970;227:728–730. [PubMed]
Stockman A, Sharpe LT, Rüther K, Nordby K. Two signals in the human rod visual system: a model based on electrophysiological data. Vis Neurosci.1995;12:951–970. [PubMed]
Stockton RA, Slaughter MM. B-wave of the electroretinogram. A reflection of ON bipolar cell activity. J Gen Physiol. 1989;93:101–122. [PubMed]
Szikra T, Witkovsky P. Contributions of AMPA- and kainate-sensitive receptors to the photopic electroretinogram of Xenopus retina. Vis Neurosci. 2001;18:187–196. [PubMed]
Tomita T. Studies on the intraretinal action potential. I. Relation between the localization of micropipette in the retina and the shape of the intraretinal action potential. Jpn J Physiol. 1950;1:110–117.
Wachtmeister L, Dowling JE. The oscillatory potentials of the mudpuppy retina. Invest Ophthalmol Vis Sci. 1978;17:1176–1188. [PubMed]
Wakabayashi K, Gieser J, Sieving P. Aspartate separation of the scotopic threshold response(STR) from the photoreceptor a-wave of the cat and monkey ERG.Invest Ophthalmol Vis Sci. 1988;29:1615–1622. [PubMed]
Witkovsky P, Dudek EF, Ripps H. Slow P-III component of the carp electroretinogram. J Gen Physiol. 1975;65:119–134. [PubMed]
Xu X, Karwoski CJ. Current source density analysis of retinal field potentials. II Pharmacological analysis of the b-wave and M-wave. J Neurophysiol. 1994;72:96–105. [PubMed]
Xu X, Karwoski CJ. Current source density analysis of the electroretinographic d-wave of frog retina. J Neurophysiol. 1995;73:2459–2469. [PubMed]
Yonemura D, Kawasaki K. The early receptor potential in the human electroretinogram. Jpn J Physiol. 1967;17:235–244. [PubMed]
Yonemura D, Kawasaki K. New approaches to ophthalmic electrodiagnosis by retinal oscillatory potential, drug-induced responses from retinal pigment epithelium and cone potential. Doc Ophthalmol. 1979;48:163–222. [PubMed]
| The authorDr. Ido Perlman was born in Haifa, Israel. He received his B.S. from the Technion-Israel, Institute of Technology, Haifa, in Chemistry in 1970 and his Ph.D. in Physiology from the University of Michigan, Ann Arbor, in 1976 under the mentorship of Dr. Matthew Alpern. Dr. Perlman then pursued postdoctoral studies with Dr. Richard Normann at the National Institutes of Health, on aspects of information processing in the turtle retina. He returned to Israel and became a professor of physiology at the Rappaport faculty of Medicine, Technion-Israel in Haifa, Israel. His research interests have continued to be information processing in the vertebrate retina with a particular interest in horizontal cell physiology. Ido has always run an advanced, scientifically-based, clinical ERG service for patients with visual disorders in northern Israel, and has made major contributions to the field of clinical ERG work. |  |