Donnell J. Creel
Introduction
The terms visually evoked potential (VEP), visually evoked response (VER) and visually evoked cortical potential (VECP) are equivalent. They refer to electrical potentials, initiated by brief visual stimuli, which are recorded from the scalp overlying visual cortex, VEP waveforms are extracted from the electro-encephalogram (EEG) by signal averaging. VEPs are used primarily to measure the functional integrity of the visual pathways from retina via the optic nerves to the visual cortex of the brain. VEPs better quantify functional integrity of the optic pathways than scanning techniques such as magnetic resonance imaging (MRI).
Any abnormality that affects the visual pathways or visual cortex in the brain can affect the VEP. Examples are cortical blindness due to meningitis or anoxia, optic neuritis as a consequence of demyelination, optic atrophy, stroke, and compression of the optic pathways by tumors, amblyopia, and neurofibromatosis. In general, myelin plaques common in multiple sclerosis slow the speed of VEP wave peaks. Compression of the optic pathways such as from hydrocephalus or a tumor also reduces amplitude of wave peaks.
This review covers a brief history of visual evoked potentials, the most commonly used stimuli to initiate visual evoked potentials, the methods of recording, the sources of visual potentials, the effects of maturation and acuity, and sample patients.
History
VEPs initiated by strobe flash were noticed in the early years of clinical encephalography (EEG) in the 1930s. A VEP can often be seen in the background EEG recorded from the occipital scalp following a flash of light (Figure 1). Evoked potentials, whether auditory, visual or somatosensory, are extracted from the EEG by a simple program. This technique of extracting a signal from random noise is one of the oldest applications of computer technology. This process is similar to programs used to extract radar signals from jamming nearly 70 years ago. Adding the electrical activity for set time periods is called “signal averaging”. Dawson first demonstrated a signal-averaging device in 1951 and signal-averaging computers have been available since the early 1960s. The computer programs save a defined time period of EEG activity following a visual stimulus, which is repeated over and over adding the signals together. The random EEG activity averages away, leaving the visually evoked potential. Depending on the signal to noise ratio, an evoked potential can be seen forming following only a few stimuli such as flashes of light.

Electrode locations on the scalp
Visually evoked potentials elicited by flash stimuli can be recorded from many scalp locations in humans. Visual stimuli stimulate both primary visual cortices and secondary areas. Clinical VEPs are usually recorded from occipital scalp overlying the calcarine fissure. This is the closest location to primary visual cortex (Brodmann’s area 17). A common system for placing electrodes is the “10-20 International System” which is based on measurements of head size (Jasper, 1958). The mid-occipital electrode location (OZ) is on the midline. The distance above the inion calculated as 10 % of the distance between the inion and nasion, which is 3-4 cm in most adults, Fig. 2. (The inion is the most prominent projection of the occipital bone at the posterioinferior (lower rear) part of the skull.) Lateral occipital electrodes are a similar distance off the midline. Another set of locations is the “Queen Square system” in which the mid-occipital electrode is placed 5 cm above the inion on the midline and 5 cm lateral from that location for lateral occipital electrodes (Blumhardt et al, 1977). The Queen Square locations, further off the midline, are better able to lateralize anomalies such as when using hemi-field stimulation. Some laboratories, and unique applications, have other preferred scalp locations.

Many laboratories record from an array of locations placed horizontally across occipital scalp in an attempt to lateralize pathology. Other laboratories use only a single positive midline recording electrode at OZ with one earlobe as negative location and the other earlobe as ground location. A second montage is necessary for recording multifocal visually evoked potentials (mfVEPs). A common mfVEP montage is to place two electrodes on the midline one just below the inion and another 3 centimeters above the inion; and laterally place electrodes 3-4 centimeters off the midline several centimeters above the inion.
Sources of visual evoked potentials
Most of primary visual cortex in humans is located in fissures, not on the cortical surface of the occipital pole. At most, only about the central 10 degrees of visual field are located on the surface of the occipital pole. Furthermore, the area located on the surface of the occipital pole is quite variable, even between hemispheres of the same individual. Because most electrical potentials are generated in sulci, simultaneously at multiple locations, and because of the vertical cancellation that occurs between upper and lower fields, lateralization of pathology is difficult. Potentials occurring at different cortical locations in vertical and horizontal planes that vary between hemispheres produce paradoxical lateralization and obscures source localization.

The series of MRIs in Figure 3a demonstrates locations of significantly higher blood flow in occipital visual areas while the subject views a video monitor. The monitor subtends a 30-degree field displaying a 100% contrast, checkerboard pattern, flashing at 4 Hz. Note the lack of high levels of activity on the surface of the occipital pole and the interhemispheric variation (Fig. 3a).
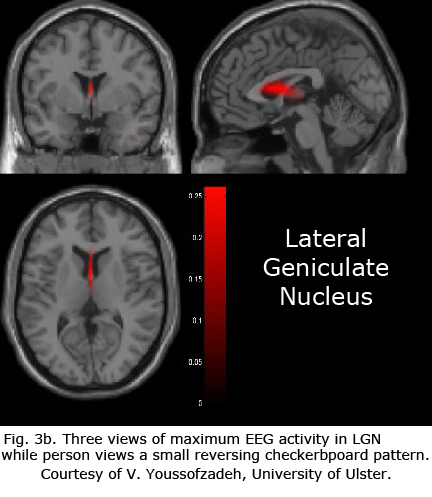
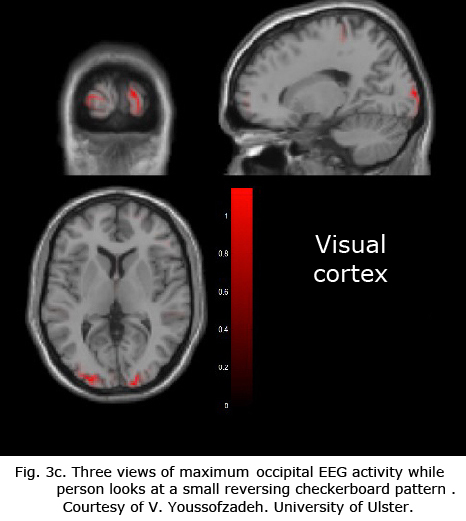
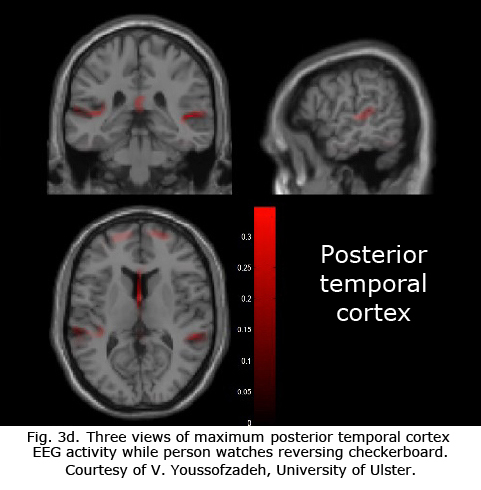
Figures 3b-d display maximum electroencephalographic (EEG) activity highlighting activity of the lateral geniculate nucleus, occipital cortex and inferior temporal cortical areas of the brain during foveal pattern reversal stimulation. The pattern stimulus was a small 5-degree field composed of 64 square checks each 36’ of arc reversing at 2/second. Each Figure includes three views: axial, sagittal, and coronal. Note the interhemispheric variability in Fig. 3a and 3c; and note checkerboard pattern reversal stimulation of the small 5-degree foveal area activates nearly as much cortical EEG surface activity as the 30-degree field of pattern stimulation displaying fMRI activity in Fig. 3a.
The neural generators of the waves of the visual evoked potential (VEP) (see Fig. 5) are not clearly defined. Research with multichannel scalp recordings, visual MRI activity and dipole modeling, supports the interpretation that the visual cortex is the source of the early components of the VEP (N1, N70) prior to P1 (“P100”) (Slotnick, et al., 1999). The early phase of the P1 component with a peak around 95-110 msec, is likely generated in dorsal extrastriate cortex of the middle occipital gyrus. The later negative component N2 (N150) is generated from several areas including a deep source in the parietal lobe (DiRusso et al., 2002).
As depicted in the functional visual MRIs in Figure 3a, brain activity varies considerably in the occipital area. A number of dipole fields are generated resulting in a complicated interaction (Towle et al., 1995). These multiple sites of generators interact at different levels in the visual areas making source localization difficult when making individual clinical decisions. Because of individual idiosyncrasies in occipital anatomy and visual projections, one cannot make the assumptions about sources that one can using electroretinograms or auditory brainstem responses (see basic and clinical chapters on ERGs).
VEP Recording methods
When applying electrodes, and cleaning scalp locations for electrodes one must remember the computer adage “garbage in, garbage out”. Scalp locations need to be cleaned to produce low electrode impedance. One must be precise about recording with low impedance and choosing electrode locations.
A reference electrode is usually placed on the earlobe, on the midline on top of the head or on the forehead. A ground electrode can be placed at any location, mastoid, scalp or earlobe. The time period analyzed is usually between 200 and 500 milliseconds following onset of each visual stimulus. When testing young infants, analysis time should be 300 msec or longer because components of the VEPs may have long peak times during early maturation. Most children and adults may be tested using an analysis time of 250 msec or less. The most common amplifier bandpass frequency limits are 1 Hz and 100 Hz. Amplifier sensitivity settings vary with +/- 10 uV common for older children through adults and +/- 20 to 50 uV for infants and younger children. Sometimes the sensitivity setting must be changed to accommodate larger EEG voltage in all age groups. See the ISCEV (International Society for Clinical Electrophysiology of Vision) standard for clinical VEPs for variety of recommended test protocols (Odom et al. 2009). Commonly used visual stimuli are strobe flash, flashing light-emitting diodes (LEDs), transient and steady state pattern reversal and pattern onset/offset.

Fig. 4. Checkerboard pattern with red fixation point.
The most common stimulus used is a checkerboard pattern, which reverses every half-second (Figure 4). Pattern reversal is a preferred stimulus because there is more inter-subject VEP reliability than with flash or pattern onset stimuli. Several laboratories developed pattern reversal visual stimuli in the 1970s including A. M. Halliday at Queen Square in London and Lorrin A. Riggs at Brown University. Originally Halliday back-projected a checkerboard pattern onto a translucent screen with two projectors that each projected reversed checkerboard images. Camera shutters on each projector controlled the display of each checkerboard reversing at a rate 2 per second. Riggs originally projected alternating vertical stripes using a reversing mirror system. Commercially produced visual evoked potential systems simulating these pattern reversals now use video monitors.

Using cathode ray tube monitors (CRT) nearly everyone with close to normal visual function produces a similar evoked potential using pattern reversal stimuli. There is a prominent negative component at peak time of about 70 msec (N1 (Fig. 5), a larger amplitude positive component at about 100 msec (P1, Fig. 5) and a more variable negative component at about 140 msec (N2, Fig. 5). The major component of the VEP is the large positive wave peaking at about 100 milliseconds (Fig. 5). This “P100” or P1 in the jargon of evoked potentials, is very reliable between individuals and stable from about age 5 years to 60 years. The mean peak time of the “PI00” only slows about one millisecond per decade from 5 years old until 60 years old.
Video monitors that produce brighter, faster changing patterns such as liquid crystal displays (LCD) evoke faster VEPs than cathode ray tube video monitors. The “P100” or P1 component is much faster using liquid crystal displays (LCD) evoking P1 peak time times of less than 90 milliseconds. Variation in stimulus parameters is a good reason for each laboratory to have their own normative data even if the manufacturer provides such data.
The size of each check in the pattern and size of the visual field affects the VEP. Most laboratories initially screen patients using a video display with field subtending 10-40 degrees of arc and fairly large individual check size of about 1 degree of arc. A large check size is used because most clinical laboratories are recording from patients who lack good visual acuity. The largest amplitude, fastest peak time VEP is recorded using the smallest check size the subject can see sharply. A person with 20/20 (6/6) or better vision will produce the largest amplitude, fastest VEP components using a small check size (a visual field comprised of checks only 5-6 mm viewed at 1 meter). Each check would measure about 15-20′ of arc. A person with poor visual acuity would produce the largest amplitude, fastest components with a larger check size subtending a degree or more (such as a 20 mm check or larger viewed at 1 meter distance). This is the basis for one being able to estimate acuity by testing a subject with several check sizes. The “P100” (P1) component is sensitive to defocusing and can, therefore, be measured following stimulation with different check sizes to estimate refractive error. For most clinical screening, a single check size of about 1 degree of arc, or a little smaller, such as about 50′ of arc, is sufficient. One need not use larger checks for children. Once a child is mature enough to attend and maintain fixation their visual systems are mature enough to use the same size stimuli as adults. Also recording pattern reversal VEPs with smaller check size of approximately 0.25 degree will contribute useful information.
The VEP waveform, amplitudes and peak times depend upon the parameters of the stimulus. Steady state VEPs are those recorded using stimulation rates of 3 or more per second. Transient VEPs are recorded using rates of less than 3 per second. Transient pattern VEPs have components that can be followed during maturation, pathological conditions and changes of acuity. Flash-evoked and pattern onset VEPs are reliable in form within the individual but vary considerably between patients. The checkerboard pattern can also be made to appear (onset) and disappear (offset). In many individuals the pattern onset VEP is opposite in polarity compared to flash and pattern reversal VEPs. The pattern onset VEP usually includes a positive component at about 80 msec and a large negative component at about 110 msec. Another advantage of the pattern reversal VEP is that it has a smaller standard deviation for the P1 component (about 6 msec). The P110 component of the flash VEP and the N110 component of the pattern onset VER have standard deviations of about 10 msec.
Maturation of VEPs with age
By age three years, children can usually co-operate fully allowing use of the same recording parameters as adults. The problem is not that a child’s visual system is developed insufficiently. It is. The problem for children less than 3 years of age is one of maintaining fixation. Below approximately age three, in examinations under anesthesia, trauma cases and other causes of very poor vision flash stimuli generated by strobe or LED flash may be required. Retinal development, cortical cell density, myelination and visual acuity are close enough to that of an adult by age 5 years, that children by this age produce adult VEP waveforms. There are changes that take place into adolescence, but these have subtle effects on the VEP.
Thus, the most dramatic changes are in the first several years after birth (Fulton et al., 2005). What will mature into the “P1” component of the flash VEP can be recorded in the full term infant within 5 weeks of age with a peak time of less than 200 msec. VEPs change rapidly in form and complexity in the first six months. As the infant matures this late “P1” appears earlier and earlier so that by about age 4-5 years, peak time shortens to about 100 msec using pattern reversal stimuli, and about 110 msec using flash stimuli. Peak times remain at this point for most of one’s adult life with no statistically significant change until after age 55 years.
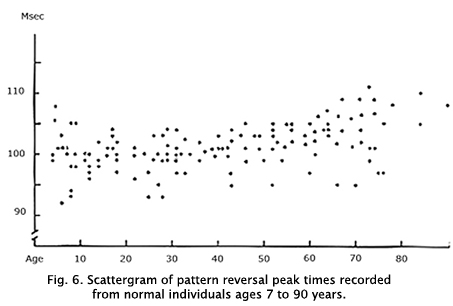
Components of the VEP change gradually after age 55 displaying attenuation in amplitude and slowing of the P1 component. Thus, the two periods in life that vary most in VEP physiology are the first few years during early maturation and during aging after age 60 years. Aging adults late in life vary even more than developing children. Figure 6 shows a sample scattergram of P1 peak times across age.
The amplitude of the mature P1 component of flash and pattern VEPs is greatest at about age 7-8 years. The brain reaches 90% of adult size as early as age 6 years. Preadolescence is the period when the brain is largest relative to skull, scalp and muscle thickness. As children enter adolescence and mature these tissues thicken attenuating the brain’s signal as recorded from the overlying scalp. The amplitude and speed of VEPs remains stable until about age 28 years at which time amplitudes begin to attenuate (Emmerson-Hanover, 1994).
The VEP recorded from mid-occipital scalp is about 90% weighted in that it reflects the function of the central 10 degrees of the visual field. Ten degrees is about the maximum visual field that is on the occipital cortical surface. Whatever method is used it is important for a laboratory to replicate testing of each subject and to gather normative data. Each subject should be placed the same distance from the visual stimuli, and room lighting should be the same.
VEPs quantify visual system function. Abnormal VEPs can be symptomatic of dysfunction, but are not diagnostic of it until carefully considered within the context of the patient’s clinical picture. When recording VEPs the diagnostic yield is dependent upon appropriate selection of visual stimuli.
If the history and ophthalmic examination of a patient raises the possibility of dysfunctional retina, optic nerves, tracts or cortices, the VEP may yield diagnostically useful information. A common clinical referral is patients where the question is whether their visual problems are due to retinal or central visual dysfunction. Recording both an electroretinogram (ERG) and VEP will usually answer this question
VEP testing under anesthesia (E.U.A.)
Examinations under anesthesia (E.U.A.) can be conducted recording both VEPs and ERGs. Anesthesia is used for various reasons ranging from the patient is unexamineable while alert to, more often, that some of the examination procedures are uncomfortable or painful (such as biopsies). Unfortunately, anesthesia affects the VEP varying with type and depth of anesthesia. Most surgical deep anesthetics obliterate the cortical activity necessary to produce the VEP. Yet auditory brainstem responses (ABRs) and somatosensory evoked potentials (SEPs) can still be recorded. Most VEP computers display the EEG. If the EEG is flat you will not record VEPs.
Anesthesiologists start with fairly deep anesthesia while putting in lines. I usually ask the anesthesiologist: “When the patient is stable will you please lighten the anesthesia as much as you are comfortable with.” Ask permission before touching the patient. This is especially important if you wish to raise the head to place the occipital electrode. Raising the head may crimp the tracheal tube.
If recording both ERGs and VEPs under anesthesia, record the ERG first because it is more resistant to anesthesia. In the minutes it takes for the ERG recording, the patient’s anesthetic depth lightens further. Rarely must one wait more minutes for the patient to lighten anesthetic depth. Oral glucose or sucrose produce analgesic effects for procedures in infants up to 18 months of age including recording ERGs (Pasek & Huber, 2012).
The influence of refractive error
If pattern stimuli are to be used, it is important that a patient be tested with refractive error corrected. Refractive errors will affect the interpretation of the VEP results. For example, adults with LASIK correction so that one eye is for distance vision, the other for near, will affect VEP amplitudes and peak times. Select the most powerful stimulus that the visual acuity and cooperation of the patient will allow. If the corrected visual acuity of the patient is approximately 20/200 (6/60) or better, and the patient does not have nystagmus, the stimulus of first choice would be pattern reversal starting with about a 50′ check. If the resulting VEP appears well formed, and if measuring acuity is an issue, next use a smaller check size in the range of about 15-20′ of arc. When testing for refractive errors such as estimating acuity, smaller check sizes (e.g., 15′) and lower contrast (<50%) are recommended. In the normal infant 20/20 (6/6) vision is present by about 9 months of age. Check sizes subtending 10-20′ of arc are the best stimuli for testing foveal vision. Checks of 40-50′ are superior in evaluating parafoveal function, therefore using more than one check size increases diagnostic yield. If the resulting VEP using the 50′ check is poorly formed, retest using a larger check size or use a pattern onset stimulus. Pattern reversal stimuli are the best choice in cooperative patients with good visual acuity, particularly when testing for possible effects of optic neuritis, hydrocephalus, ventriculitis, cortical hematomas, optic atrophy, neurofibromatosis or compression of the optic pathways.
If the corrected acuity of the patient is approximately 20/200 to 20/400 (6/60-6/120) and/or the patient has nystagmus, the preferred stimulus would be pattern onset. Pattern onset or “pattern flash” stimuli produce a more robust VEP than does pattern reversal. Pattern reversal stimuli usually exacerbate nystagmus interfering with the ability of the eye to maintain foveal fixation. Pattern onset stimuli can also be the most productive stimulus in conditions such as monitoring amblyopia, in patients with poor acuity, possible hemispheric asymmetry or a defect in geniculo-striate projections. Pattern onset usually produces a more robust VEP initiated from the central 30 degrees of retina (Hoffmann et al., 2003). Pattern onset stimuli are also useful examining patients that might be malingering because pattern onset is less sensitive to poor fixation, eye movement and deliberate defocusing.
If the patient’s acuity is approximately 20/400 (6/120) or worse, or the patient is uncooperative, unconscious, sedated or anesthetized, or with ocular opacities, the stimulus of choice is strobe or LED flash. Flash stimuli are useful in infants who will not maintain fixation on a pattern. The resulting VEP will usually detect significant optic atrophy and other abnormalities of the central visual pathways. In many cases of cortical blindness the flash VEP will be abnormal, although it is possible to record a normal flash VEP. The VEP is often prognostic in delayed maturation of the visual system (usually the infant with delayed maturation has a normal flash VEP), whereas permanently cortically blind infants have abnormal VEPs. Flash stimuli produced by LEDs can be useful in some patients. LED arrays are available inside goggles and on handheld stimulators producing range of flash colors. These are more effective than a strobe lamp for monocular stimulation, and useful in the operating room when monitoring VEPs during surgery or E.U.A.
For initial screening of most patients the electrode montage of choice is a single recording electrode placed on the midline overlying the central pole of the occipital cortex, which lies approximately 3-4 cm above the inion. The VEP recorded from this location exaggerates the contribution of the macular portion of the retina due to the fact that only the macula is projected onto the occipital pole. This recording site is referred to an electrode placed on the earlobe or on the midline of the upper forehead or head. There is no significant difference in the VEPs obtained using most reference points although technically the earlobe is the more electronically neutral site than scalp locations. As mentioned earlier, correct lateralization of pathology by using recording electrodes off the midline overlying occipital cortex, is difficult using the VEP. Information obtained from computed tomography (CT) and MRI scans better localize such pathology.
Examples of VEP recordings in different retina-brain pathologies
There are hundreds of syndromes and visual anomalies that can affect VEPs. A limited sampling is presented but in the same format as in Figure 7 for all the following case figures. The N1 wave is called N75, The P1 wave is called P100 and the N2 wave is called N145, in all our data (VEP normal averages under our testing conditions).
Multiple Sclerosis
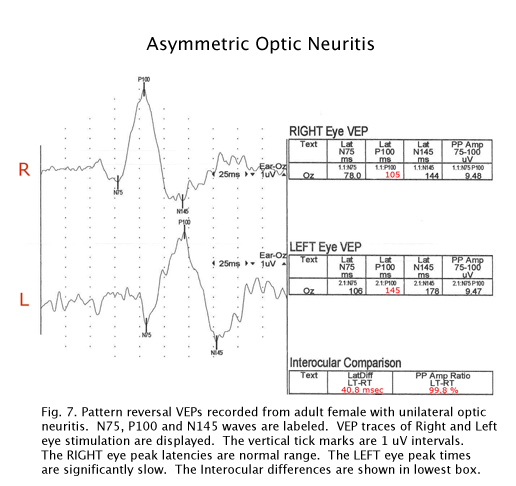
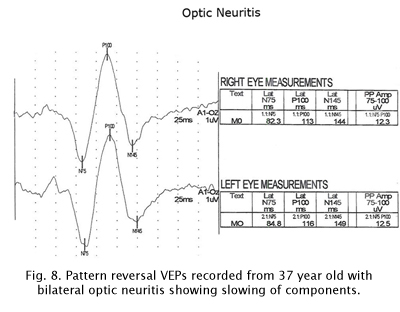
The visually evoked potentials in Figure 7 were recorded from a patient with early signs of multiple sclerosis including optic neuritis. As is usual in these cases, initially one nerve (right eye measurements, top traces, Fig. 7) yields normal range evoked potentials. The left nerve, affected with retrobulbar optic neuritis shows a delayed P100 component. Patients with MS usually develop optic neuritis later in the other nerve (Figure 8). Over the years the VEPs in patients with MS become progressively slower eventually attenuating in amplitude as demyelination increases (Figure 9).

Trauma
Another application of VEPs is to quantify visual system function following trauma. It is not unusual that compression of optic pathways immediately after severe trauma results in no recordable VEPs. However, VEPs may be recordable days later when inflammation subsides. Figures. 10, 11 and 12 show the sequence of recovery in an infant with head trauma producing compression of the optic nerves and the occipital brain area.


Tumors
Children with neurofibromatosis type 1 (NF1) are vulnerable to development of optic nerve gliomas. The VEP can be a more sensitive and cost effective test to follow the progress of nerve pathology than MRI tests alone. Essentially all children with NF1 show slowing of VEPs by school age (Fig. 13).

As is true for any space-occupying tumor or other compression such as hydrocephalus affecting visual pathways, the VEP is useful to quantify compression of pathways. The next three Figures (14, 15 and 16) show progression of development of bilateral optic nerve gliomas in a child with NF1.


Recovery of function
VEPs are also useful in following recovery of most optic pathway dysfunction.
The next two Figures 17 and 18 show flash VEPs recorded prior to and 2 weeks following removal of a large orbital mass from a 3 year old.


Figure 19 displays VEPs of another type of tumor, a unilateral neuroblastoma.

Fig. 19. VEPs of another type of tumor, a unilateral neuroblastoma.
VEPs can be useful in quantifying and following the progression of optic nerve hypoplasia, optic atrophy or pale nerve. Figure 20 is an ocular fundus photo of a child with a pale optic nerve.

Fig. 20. Fundus photo of child with pale optic nerve
Figure 21 displays flash VEPs recorded from the 9-year old child with pale optic nerves (Fig. 20) The VEPS are both attenuated in amplitude and have prolonged component peak times.

Fig. 21. Flash VEPs recorded from a 9 year old with pale optic nerves showing reduced amplitude and slow P100s.
Optic Nerve Toxicity
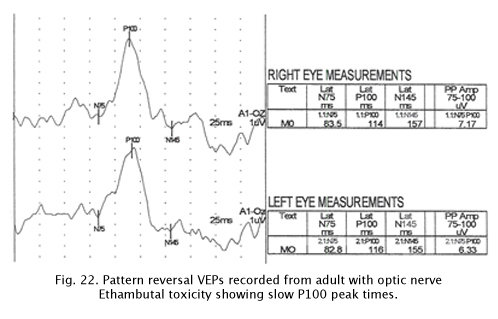
Some medications can be toxic to optic nerve function. Figure 22 displays pattern reversal VEPs in an adult with Ethambutol optic nerve toxicity. Again there are delayed peak times.
There are several medications that can be toxic to the optic nerves including Amiodarone an antiarrhythmic medication used to treat ventricular tachycardia or ventricular fibrillation. In some patients Amiodarone is associated with ischemic optic neuropathy. The VEPs of these patients show prolonged peak times.
A partial list of toxins and medications associated with optic neuropathy includes carbon monoxide, ethylene glycol, and methanol. The antimicrobials Ethambutol, Isoniazid and Linezolid, are drugs have indirect effect on the optic nerve. Sildenafil (Viagra) and Infliximab can also affect optic nerve function. VEPs also provide information about visual cortical function. VEPs, recorded from patients suffering from birth anoxia or near-death drowning, will quantify degree of occipital cortex dysfunction. In general recordable VEPs are a positive prognostic sign.
Infections
Similar to dysfunction in the visual pathways, any pathology affecting visual cortices can be quantified using VEPs. Figure 23 shows pattern reversal VEPs in an adult with meningeal tuberculosis. Here slow VEP peak times are also seen (Fig. 23).

Multifocal VEPs
An important development in VEPs is the multifocal VEP (mfVEP). Erich Sutter adapted the mathematical sequences called binary m-sequences creating a program that can extract hundreds of VEPs from occipital scalp. This program allows assessment of VEP activity in over 100 “channels” of each optic pathway (Sutter, 2010).
Traditional VEPs evaluate the optic nerves and central pathways as a whole. Often small or localized optic pathway dysfunction is not detected. Using multifocal VEP analysis one may isolate smaller dysfunctional areas using hundreds of stimulations presented in the same amount of time it would take to record a single whole nerve VEP with conventional methods (Klistorner et al., 1998). Multifocal VEPs best evaluate asymmetry of visual function caused by optic nerve dysfunction. Pathology can sometimes be detected that may be missed with a traditional single VEP.
Recording methods
Whereas stimulus patterns for multifocal electroretinograms (mfERGs) are an array of flickering patterns, multifocal visually evoked potentials (mfVEPs) are better elicited with reversing check patterns (Sutter, 2010).
Four occipital scalp electrodes are required to record mfVEPs. A common mfVEP montage is to first place two electrodes on the midline. One just below the inion and another 3-4 centimeters above the inion; and laterally place electrodes 4 centimeters off the midline several centimeters above inion. The ground lead can be anywhere on the body. See Hood et al. (2008) for suggested International Standard for recording mfERGs.
The stimulus for multifocal electroretinograms is a focal pattern stimulation m-sequence modulated flicker (See chapter on The Electroretinogram: Clinical Applications by Donnell Creel). The common stimulus for multifocal visually evoked potentials (mfVEPs) is a dartboard pattern with each sector a contrast reversing check pattern (Fig. 24).

Fig. 24. Sample dartboard pattern stimulus used to record multifocal VEPs.
Multifocal visually evoked potentials from a normal subject are shown in Figure 25. Red traces are from right eye stimulation. Blue traces are from left eye stimulation.

Sample patients
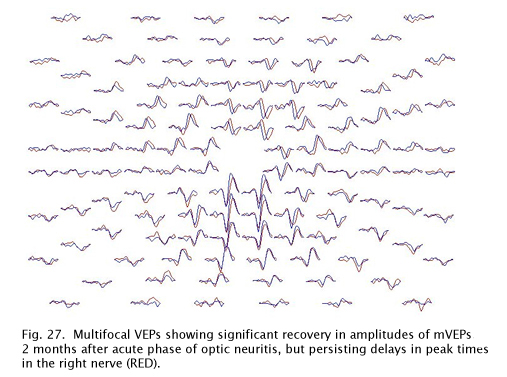
A common application of mfVEPs is recording these potentials from patients with optic neuritis. Usually optic neuritis appears first in one optic nerve. Figure 26 displays the VEPs of a patient with unilateral optic neuritis during the acute phase affecting the right optic nerve. During the acute phase most of the responses in the central 30 degrees were abnormal. Many responses in the central 5 degrees were nearly extinguished.

This same patient tested 2 months later shows significant recovery in the amplitudes of the responses, but slower peak times persist due to demyelination (Fig. 27).
An example of another optic nerve disorder is a patient with optic nerve damage due to glaucoma. The mfVEPs of a patient with unilateral glaucoma are shown in Figure 28.

Fig. 28. Multifocal VEPs recorded from a patient with unilateral right (RED) optic nerve glaucoma.
Summary
Visually evoked potentials are useful to quantitate nerve dysfunction from retina to visual cortex. VEP recordings are done by a number of methods to evaluate visual pathway function (Regan, 1989, 2008). Choices of which VEP stimuli and protocol to apply need to be made based on the patient’s symptoms, history and other information available. Abnormalities seen in VEPs are symptomatic, but not diagnostic. VEP abnormalities do not specify etiology. For example, retinal disease alone will drastically alter VEPs. Interpretation of VEPs must be considered within the context of the patient’s clinical appearance and information available from other tests and examinations.
Updated: July 14, 2015.
References
Blumhardt LD, Barrett G, Halliday AM, Kriss A. The asymmetrical visual evoked potential to pattern reversal in one half field and its significance for the analysis of visual field effects. Br. J. Ophthalmol. 1977;61: 454-61.
Di Russo F, Martínez A, Sereno MI, Pitzalis S, Hillyard SA. Cortical sources of the early components of the visual evoked potential. Hum Brain Mapp. 2002;15(2):95-111.
Emmerson-Hanover R, Shearer DE, Creel DJ and Dustman RE: Pattern reversal evoked potentials: Gender differences and age related changes in amplitude and latency. Electroenceph clin Neurophysiol 1994;92:93-101.
Fishman GA, Sokol S. Electrophysiologic testing in disorders of the retina, optic nerve, and visual pathway. 1990. San Francisco: American Academy of Ophthalmology, 1990.
Fulton A, Hansen RM, Moskowitz A. Assessment of vision in infants and young children. In: Celesia GC, ed. Handbook of Clinical Neurophysiology: Disorders of Visual Processing. New York, NY: Elsevier Science Inc; 2005.
Hoffmann, MB, Straube, S, & Bach M. Pattern-onset stimulation boosts central multifocal VEP responses. Journal of Vision, 2003;3(6): 432-439.
Hood, DC, Bach, M., Brigell, M., Keating, D., Kondo, M., Lyons, JS, Palmowski, A.M. ISCEV guidelines for clinical multifocal electroretinography. Doc Ophthalmol 2008;116, 1-11.
Jasper, HH. Report of Committee on Methods of Clinical Examination in Electroencephalography. Electroenceph. Clin. Neurophysiol., 1958;10: 370-375.
Klistorner AI, Graham SL, Grigg JR, Billson FA. Multifocal Topographic Visual Evoked Potential: Improving Objective Detection of Local Visual Field Defects Invest Ophthal Vis Sci 1998;39(6):937-50.
Odom JV, Bach M, Brigell M, Holder GE, McCulloch DL, Tormene, AP, Vaegan. ISCEV standard for clinical visual evoked potentials (2009 update) Doc Ophthalmol (2010) 120:111–119
Pasek TA, Huber JM. Hospitalized infants who hurt: a sweet solution with oral sucrose. Crit Care Nurse. 2012;32:61-9. doi: 10.4037/ccn2012912. Review. PubMed PMID: 22298719. [PubMed]
Regan D. Human brain electrophysiology. New York: Elsevier, 1989.
Regan D. Some Early Uses of Evoked Brain Responses in Studies of the Human Visual System. (2008) Vision Research (Eds. V. Lamme and D. Regan), 47, 6, v-vii.
Slotnick SD, Klein SA, Carney T, Sutter E, Dastmalchi S. Using multi-stimulus VEP source localization to obtain a retinotopic map of human primary visual cortex. Clin Neurophysiol. 1999;110(10):1793-1800.
Sutter, E. E. Noninvasive Testing Methods: Multifocal Electrophysiology. In: Darlene A. Dartt, editor. Encyclopedia of the Eye, Vol 3. Oxford: Academic Press pp. 142-160 (2010).
Towle VL, Cakmur R, Cao,Y Brigell M Parmeggiani L. Locating vep equivalent dipoles in magnetic resonance images. 1995;80:105-116.

Dr. Donnell J. Creel was born in Kansas City, Missouri. He received his B.A and M.A. from the University of Missouri at Kansas City, and his Ph.D. from the University of Utah in 1969. In 1971 Don first made the connection that visual anomalies in Siamese cats was associated with albinism and hypothesized that all albino mammals likely have optic misrouting, and published first visual evoked potential studies in human albinos in 1974 and ocular albinos in 1978. Don has been the Director of Clinical Electrophysiology at the Moran Eye Center since its inception in 1993. e-mail Don at donnell.creel@hsc.utah.edu