Donnell J. Creel
1. Introduction
Electrophysiological testing of patients with retinal disease began in clinical departments in the late nineteen forties. Under the influence of the Swedish pioneers, Holmgren (1865) and Granit (1933), the electroretinogram was being dissected into component parts and early intraretinal electrode studies were beginning to tell which cells or cell layers gave rise to the various components. A detailed discussion of the electroretinogram, or ERG as it is commonly abbreviated, is found in the accompanying chapter by Ido Perlman. A little after the introduction of the ERG as a test of the state of the patient’s retina, another diagnostic test called the electrooculogram (EOG) was introduced to the clinic (Arden et al., 1962). The EOG had advantages over the ERG in that electrodes did not touch the surface of the eye. The changes in the standing potential across the eyeball were recorded by skin electrodes during simple eye movements and after exposure to periods of light and dark. Over the years ERG recording techniques have become progressively more sophisticated in the clinical setting. With the advent of perimetry, optical coherence tomography (OCT) and pattern ERG techniques, more precise mapping of dysfunctional areas of the retina is now possible. The most recent advance in ERG technology is the multifocal electroretinogram (mfERG). The mfERG provides a detailed assessment of the health of the central retina.
Where the previous chapter (The electroretinogram: ERG, Ido Perlman) presents the basic science behind the waveforms and components of the massed ERG response, in this chapter the intention is to show the clinical use of the various electrophysiological tests. The chapter is based on experience in the ERG clinic of the Moran Eye Center.
2. The electroretinogram ERG.
The global or full-field electroretinogram (ERG) is a mass electrical response of the retina to photic stimulation. The ERG is a test used worldwide to assess the status of the retina in eye diseases in human patients and in laboratory animals used as models of retinal disease.
The basic method of recording the electrical response known as the global or full-field ERG is by stimulating the eye with a bright light source such as a flash produced by LEDs or a strobe lamp. The flash of light elicits a biphasic waveform recordable at the cornea similar to that illustrated below (Fig 1). The two components that are most often measured are the a- and b-waves. The a-wave is the first large negative component, followed by the b-wave which is corneal positive and usually larger in amplitude.
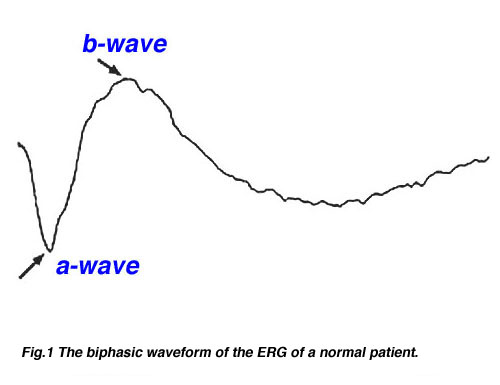
Fig.1 The biphasic waveform of the typical normal patient
An Early Receptor Potential (ERP) is a very fast biphasic wave appearing in the first 2 milliseconds following a bright flash, prior to the a-wave, reflecting the earliest chemical responses to light in the receptor outer segments (Figure 1a). Approximately 70% of the contribution is from cones. The ERP latency is less than 1 microsecond. Due to photovoltaic effects ERPs are best recorded using no metal such as with cotton wick contact shown in Fig 4. The ERP is difficult to record and is not commonly used clinically.
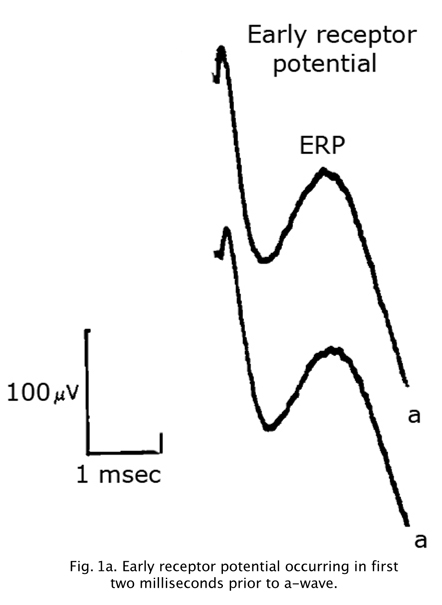
Fig. 1a. Early receptor potential occurring in first two milliseconds prior to a-wave.
Figure 1b depicts a concocted ERG of all components if one would stimulate the retina with a long light pulse producing an off response.
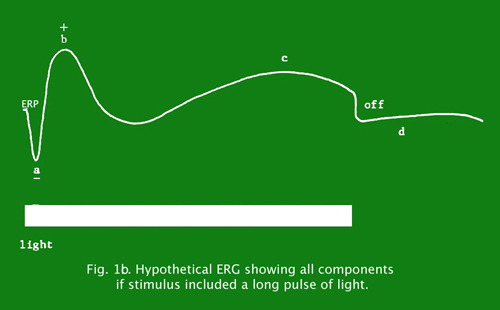
Fig. 1b. Hypothetical ERG showing all components if stimulus included a long pulse of light.
Two principal measures of the ERG waveform are taken: 1) The amplitude (a) from the baseline to the negative trough of the a-wave, and the amplitude of the b-wave measured from the trough of the a-wave to the following peak of the b-wave; and 2) the time (t) from flash onset to the trough of the a-wave and the time (t) from flash onset to the peak of the b-wave (Fig. 2). These times are referred to as “implicit times” in the jargon of electroretinography.
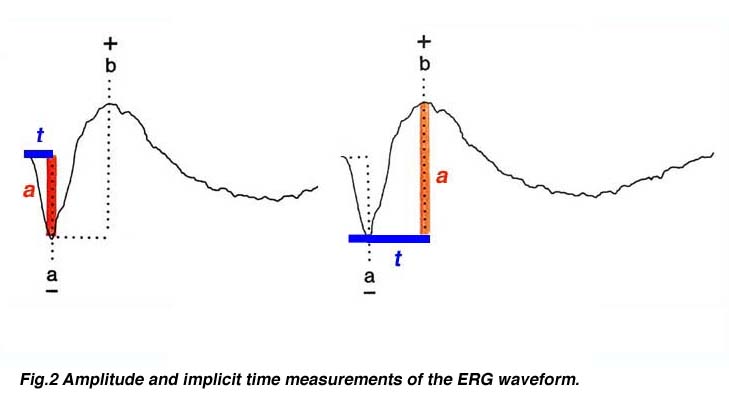
Fig.2 Amplitude and implicit time measurements of the ERG waveform
The a-wave, sometimes called the “late receptor potential,” reflects the general physiological health of the photoreceptors in the outer retina. In contrast, the b-wave reflects the health of the inner layers of the retina, including the ON bipolar cells and the Muller cells (Miller and Dowling, 1970). Two other waveforms that are sometimes recorded in the clinic are the c-wave originating in the pigment epithelium (Marmor and Hock, 1982) and the d-wave indicating activity of the OFF bipolar cells (see Figure 3). Later we shall discuss some wavelets that occur on the rising phase of the b-wave known as oscillitatory potentials (OPs). OPs are thought to reflect activity in amacrine cells (Fig. 3).
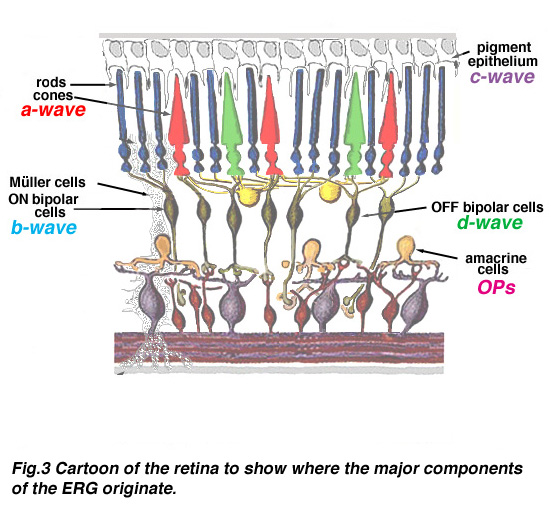
Fig.3 Cartoon of the retina to show where the major components of the ERG originate
Some companies providing electrophysiology recording equipment offer normative data. A laboratory should test normal subjects to ensure their testing environment produces similar results. Our normal reference group is 250 adults age 22 to 42 screened for normal visual fields, best corrected acuity of 20/20 (6/6) or better, and normal color vision without history of ocular or systemic disease.
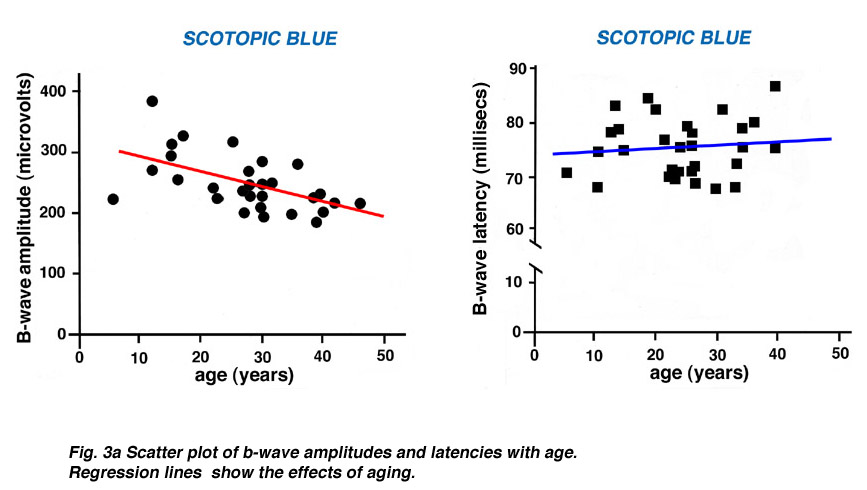
The ERG of a normal full-term infant looks similar to a mature ERG. A normal ERG in a newborn infant can be small amplitude the first couple of months. The ERG attains peak amplitude in adolescence and slowly declines in amplitude throughout life (Weleber, 1981). After age 55-60 years the amplitude of the ERG declines even more. Implicit times slow gradually from adolescence through old age as well. Below are two figures illustrating how the b-wave attenuates in amplitude with age and slows in its implicit time (Fig. 3a). There is considerable variation among individuals but the linear regression line in each figure indicates the trend of aging affects on the ERG.
3. ERG recording electrodes.
The ERG can be recorded several ways. The pupil is usually dilated. There are a number of corneal ERG electrodes that are in common use. Some are speculum structures (Fig. 4) that hold the eye open and have a contact lens with a wire ring that “floats” on the cornea supported by a small spring. Some versions use carbon, wire or gold foil to record electrical activity. There are also cotton wick electrodes (Fig. 4).
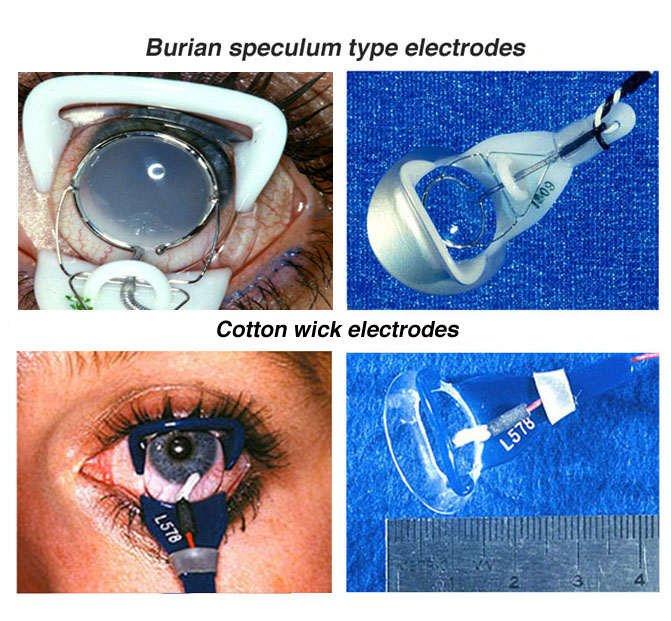
Fig.4 Speculum or Burian type electrodes used to record the human ERG
There are yet other simpler ERG recording devices (Fig. 5) using gold Mylar tape that can be inserted between the lower lid and sclera/cornea. Most electrodes are monopolar, i.e., are referred to another electrode site most commonly on the forehead. Some are bipolar with the reference electrodes built into a metal surface on a speculum.

Fig. 5 Other simple types of electrode used to record the human ERG
Each of these electrodes record large voltage responses directly from the cornea or sclera and each have advantages and disadvantages. We use Burian speculum electrodes when possible. Sizes are available down to a size that fits in the eye of most full-term babies. When the eye is too small for speculum recording electrodes we use the ERG Jet type most of the time. When the eye is very small such as in some microphthalmic eyes or cases of trauma to tissue surrounding the eye, we use ERG Jet, DTL silver thread or Arden gold foil.
The ERG can also be recorded using skin electrodes placed just above and below the eye, or below the eye and next to the lateral canthus. Since skin electrodes are not in direct contact with the eye there is significant attenuation in amplitude of the ERG, so a number of individual responses to flash stimulation are usually averaged by computer. Pictured in Figure 6 is a comparison of bright white flash ERGs recorded from the same person using three types of recording devices and an averaged ERG from skin electrodes.
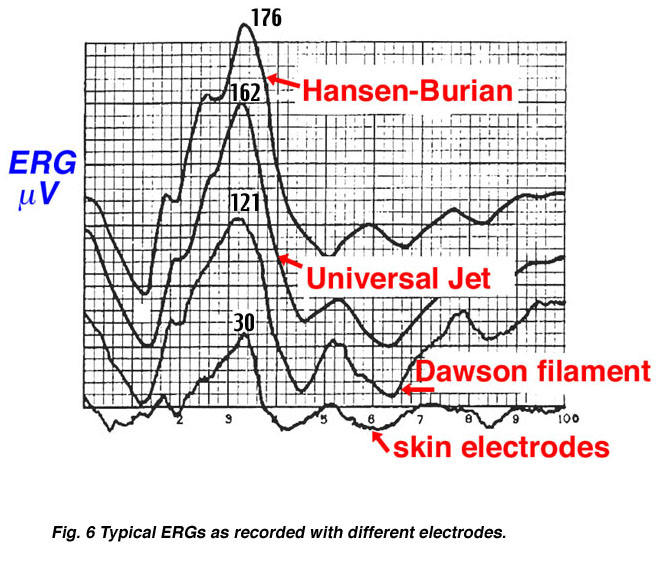
Fig. 6 Typical ERGs as recorded with different electrodes
If electrodes are to be reused, they should be sterilized with a solution that neutralizes prion-transmitted diseases such as Creutzfeldt-Jakob disease (CJD). Follow sterilization recommended by the manufacturer. We use household clothing bleach (active ingredient sodium hypochlorite), diluted to a 10% solution with distilled water. Do not leave electrodes in this solution for more than a few minutes.
4. Light stimulation for ERGs.
There are also several methods of stimulating the eye. Some laboratories use a strobe lamp that is mobile and can be easily placed in front of a person whether sitting or reclining (Fig. 7). The mobility of a strobe lamp or an array of LEDs is a necessity in some situations such as at the hospital bedside or in the operating room.
 Fig. 7. Portable strobe light source |
 Fig. 8. The Ganzfeld stimulation globe |
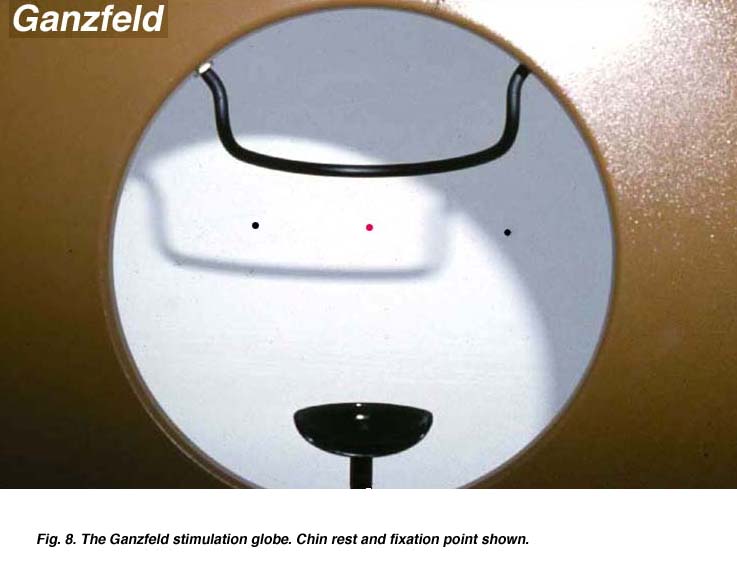
For patients over 5 years of age most laboratories use a Ganzfeld (globe) with a chin rest and fixation points (Fig. 8). The Ganzfeld allows the best control of background illumination and stimulus flash intensity. Either strobe lamp or Ganzfeld methods of flash presentation can be used to record the ERG following a single flash or to average responses to several flashes with the aid of a computer. Clinical decisions can be made from ERGs generated by either methodology.
Testing infants for ERGs
Infants up to about 2 years of age can usually be tested without sedation by the parent holding them bundled in a blanket. It is difficult to convince a child less than 5 years of age to allow a contact lens or speculum recording electrode in their eye. Alternatively, the child is sedated or anesthetized. Oral glucose or sucrose can be used for analgesia for procedures in infants up to 18 months of age, including recording ERGs (Pasek & Huber, 2012).
ERG testing is also sometimes performed as part of a more extensive exam under anesthesia (EUA). Few laboratories have Ganzfeld stimulators that can be tilted and placed over the face of a sedated patient and it is difficult to use such equipment in the operating room. Thus flash stimuli with sedated patients are usually delivered with a strobe lamp (Fig. 7) or LED stimulators. Mesopic single flashes, oscillatory potentials and 30 Hz flicker can be used to evaluate retinal function.
It is difficult to completely darken the O.R. so abbreviated testing is accomplished under mesopic and photopic light conditions. Anesthesia affects the ERG varying with type and depth of anesthesia. Some anesthetics can attenuate b-wave amplitude as much as 50%. Light levels of anesthesia have little affect and most anesthetics do not affect a-waves or implicit times. Coordinate with anesthesiologists to attain a light level of anesthesia.
Separating rod and cone ERGs
Most disorders of the retina are detected by an attenuation of amplitude. Implicit times, of both a- and b-waves are also affected in some conditions. Implicit times and amplitudes vary depending upon whether the eye is dark adapted or not, and brightness and color of the light stimulus. These parameters allow separation of rod and cone activity in any duplex retina.
Rods and cones differ in number, peak color sensitivity, threshold and recovery. There are about 120 million rods in each retina and about 6-7 million cones (see Facts and Figures chapter). Because of sheer numbers, the ERG following a white flash is dominated by the mass response of the rods. By manipulating adaptation level and background illumination, flash intensity, color of the flash and rate of stimulation, rod and cone activity can be significantly isolated.
Using color stimuli
Peak wavelength sensitivity for rods is around 510 nm and the peak sensitivity of cones as a group is about 560 nm (Tennis ball yellow) (Fig. 9). By using color filters such as the Kodak Blue and Red Wratten series, or color flashes generated by LEDs (Figure 9a), you can isolate rod and cone ERGs using dim flash stimuli into photopic (cone)and scotopic (rod) signals as illustrated in Figure 9b. Dim red flashes stimulate both rod and cone function producing a small photopic component bx and larger rod b-wave. Rods are about three log units more sensitive than cones. However cones recover faster than rods.

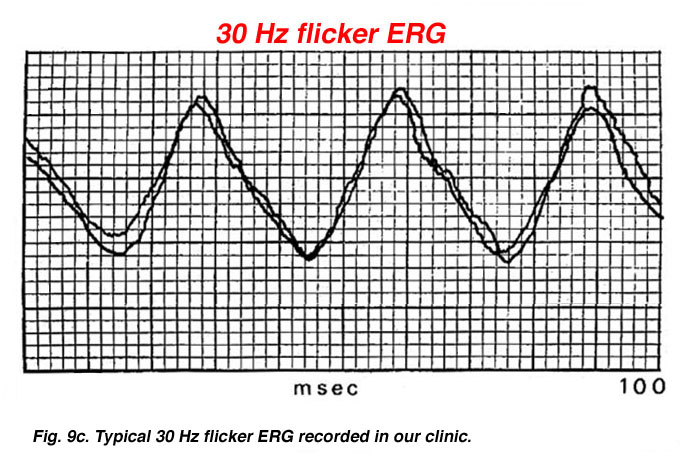
Using different rates (flicker) of stimulus presentation also allows rod and cone contributions to the ERG to be separated. Even under ideal conditions rods cannot follow a flickering light up to 20 per second whereas cones can easily follow a 30 Hz flicker, which is the rate routinely used to test if a retina has good cone physiology (Fig. 9c).
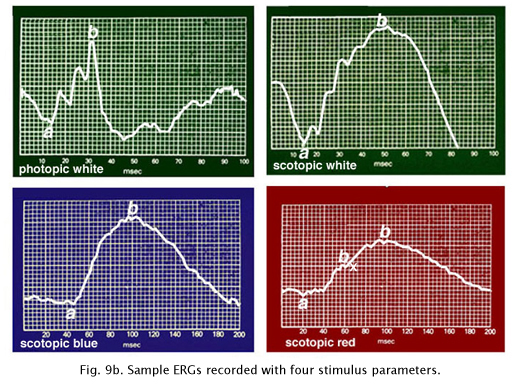 Fig. 9b. Typical testing parameters used in our ERG recording set up |
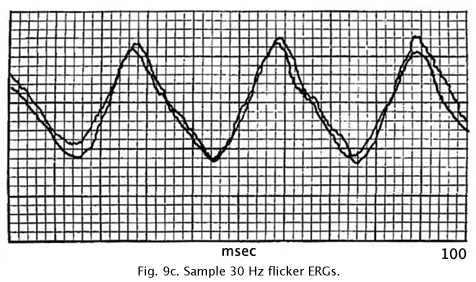 Fig. 9c. Typical 30 Hz flicker ERG recorded in our clinic |
5. ERG recording methods.
There are many ways of recording ERGs from patients. I recommend reviewing ISCEV standards for recording ERGs (McCulloch et al., 2015). Most procedures give similar results but vary mainly in sequence. Some laboratories record the light adapted state first and others dark-adapt first. Some laboratories use only white flashes and others include colored flashes. Many laboratories use a scotopic intensity series as well. Supplemental analysis such as Perlman’s (1983) relationship between the ratio of a- and b-wave amplitudes can be extracted from this intensity series. If only bright white flash stimuli are used subtle abnormalities will be missed.
Manufacturers of electrophysiology systems usually provide normative data. The ERGs that are most difficult to interpret are those initiated by 30 Hz flicker. Unless a patient is anesthetized or sedated lid muscle artifact usually attenuates the amplitude of 30 Hz flicker ERGs because the flashes are irritating. A low-amplitude 30 Hz flicker response is not an accurate reflection of cone physiology if amplitudes are disproportionally smaller than single flash photopic b-wave amplitudes.
Method at Moran Eye Center
1. Dark adapt patient for a set time of 30 minutes.
2. Attach electrodes using dim red illumination. We use an indirect headlamp with several Wratten 26 red filters so that it simulates a mobile dark room “safe” light.
3. Record ERG using single scotopically-balanced dim blue and red flashes, and bright white flashes as illustrated in sample ERGs of Figure 9b. Some laboratories average several responses.
4. Turn on moderately high background illumination of about 10 ftL for about 10 minutes and record ERGs using 30 Hertz flicker, bright white flashes and oscillatory potential as illustrated (Fig. 9c). Responses recorded using moderately high background illumination accentuate the cone system by bleaching the rods and only cones can recover fast enough between flashes to accurately follow a flickering 30 Hertz light.
Recording scotopic ERGs
Thirty minutes or more in the dark produces a state of 98% dark adaptation in most individuals. Reducing flash intensity two or more log units and using deep blue color limit stimulation to the rods. “Scotopically balanced” blue and red flashes (Fig. 9b) mean that dim blue and red flashes with transmission spectra that do not overlap are matched through trial and error until the ERGs produce b-wave amplitudes of the same size (Fig. 9a). The purpose of this is to establish a standard so that differences between rod and cone physiology can be more easily detected. The scotopic dim blue ERG is most sensitive not only to rod disorders but also to systemic metabolic aberrations and retinal toxicity.
6. Oscillatory Potentials OPs.
Some laboratories also include recording oscillatory potentials. Oscillatory potentials (OPs) seen on the ascending limb of most b-waves in both scotopic and photopic bright flash ERG recordings were first described by Cobb and Morton (1954). By raising the low bandpass from the usual <1 Hz up to around 100 Hz the slower a- and b-wave components are filtered out leaving a burst of cone oscillatory potentials following a bright white flash between about 15 and 40 msec (Fig.10). Scotopic rod OPs produced by dim blue flash appear later between about 25 and 55 msec. Oscillatory potentials are thought to reflect activity initiated by amacrine cells in the inner retina (Wachtmeister and Dowling, 1978).
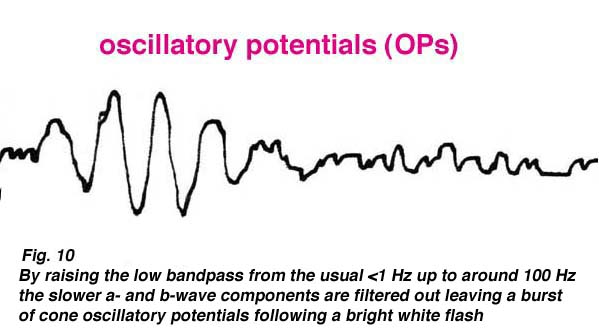
Fig. 10 Oscillatory potentials
This brings up an interesting clinical anecdote which also indicates the ERGs vulnerability to changes in retinal chemistry. Until recently for over 50 years the irrigating solution of choice when removing enlarged prostate glands was glycine. When the procedure took a long time or the surgeon cut deeply into the venous beds surrounding the prostate gland, an awake patient under spinal block anesthesia has said, “Why did you turn the lights off?” This can create considerable consternation among personnel in a brightly illuminated operating room. Glycine is an inhibitory transmitter in the retina particularly associated with amacrine cells. When the glycine reaches retinal circulation it short circuits the amacrine cell pathways in the retina and turns off the source of oscillatory potentials (Creel et al, 1987). Oscillatory potentials specifically disappear from the ascending limb of the b-wave. Oscillatory potentials and vision return to the patient over several hours as the glycine is metabolized (Fig. 11).
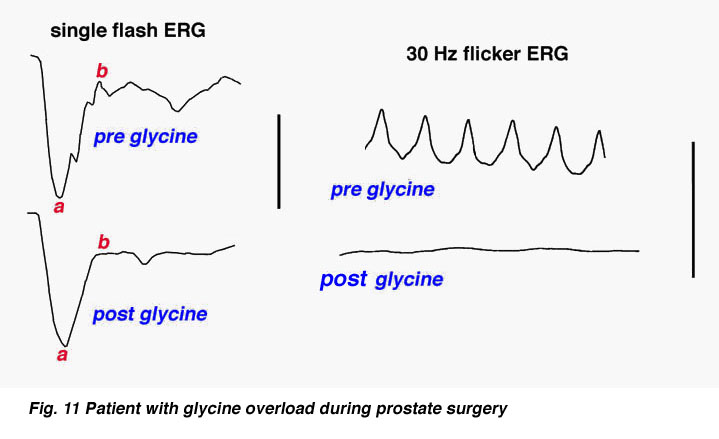
Fig. 11 Patient with glycine overload
Oscillatory potentials are significantly attenuated in various retinal degenerations amongst them are the following:
Retinitis pigmentosa
Central serous retinopathy
CSNB Type 2
Birdshot choroidopathy
Retinoschisis
Carriers of X-linked CSNB
Diabetic retinopathy
Hypertensive retinopathy
CRVO and CRAO
Takayasu’s (pulseless) disease
7. ERGs in retinitis pigmentosa-like diseases.
In all forms of retinal pathology there is considerable variability. There are no absolute rules. Genetic variation in penetrance and expression in combination with individual differences affects retinal electrophysiology.
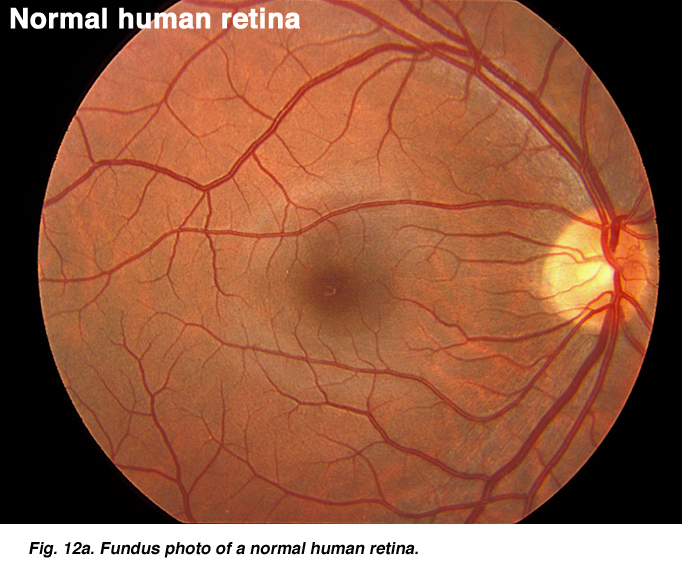 Fig. 12a. Fundus photo of a normal human retina |
 Fig. 12b. Fundus photo of a patient with retinitis pigmentosa |
ERGs recorded from a representative normal subject (Fig. 12a) and from a patient with retinitis pigmentosa (RP) (Fig. 12b) using the above methodology are illustrated in figure 13. The scotopic blue and red ERG traces are 200 milliseconds and the other traces are 100 milliseconds. The vertical calibration is 100 microvolts. The low bandpass limit was 0.1 Hz and the upper 1 KHz. When dim stimuli are used such as an intensity series starting with low intensity white or dim scotopic red and blue flashes it is important that the low bandpass be less than 1 Hz. The slow b-wave initiated by dim stimuli will be attenuated if a low bandpass is not used.
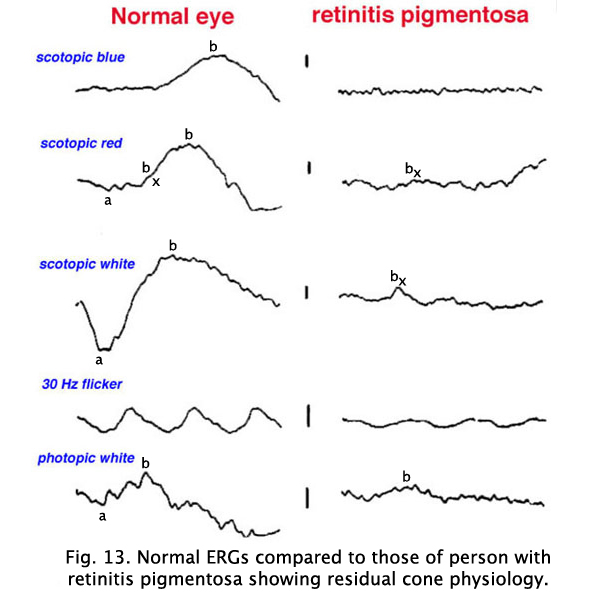
Fig. 13 ERG recordings in a normal patient and one with retinitis pigmentosa
The first two responses are scotopically matched blue and red ERGs. The blue flash was dim enough that no a-wave can be discerned in a normal patient leaving only the rod-dominated slower b-wave. The red flash is bright enough that photopic oscillations and bx component can be observed just after the a-wave (Fig. 13). The bx component appears in dim red scotopic ERGs at the time a photopic single flash b-wave would appear. Bright white flash in the dark produces the largest amplitude ERG. The 30 Hz flicker illustrates the response of the rapidly recovering cones, and the photopic response is representative of a normal response with the more sensitive rods bleached by background illumination. Oscillatory potentials on the ascending b-wave are seen in responses to moderate-high intensity white flashes and in response to red, yellow, and green flashes (Fig. 13).
This particular case of retinitis pigmentosa (RP) was selected because the individual was tested early in the onset of retinitis pigmentosa, as a young adult when she still had remnants of a cone ERG. As in most cases of retinitis pigmentosa, the rods are affected most severely as evidenced by the extinguished response to the blue flash. Although it may take some imagination, some of those “squiggles” in the first half of the response to red flashes are remnants of photopic cone physiology. There are also remnants of cone physiology in the responses to bright white flash in the dark, 30 Hz flicker and photopic white flash. In many individuals with RP the electrophysiological progression is more severe with all ERGs extinguished, similar in appearance to the response to scotopic dim blue flash. Both scotopic and photopic b-wave peak implicit times are usually prolonged. Almost always it is impossible to record oscillatory potentials.
Early in the clinical onset of RP, with the exception of severe expressions such as Leber’s congenital amaurosis or X-linked RP (Fig. 14), there are recordable ERGs at least to bright photopic stimuli. Some individuals with dominantly inherited RP maintain recordable ERGs throughout most of their lives. I have tested over 100 members of one extended family with dominantly inherited RP. Some of the affected members showed no usual ERG changes until their mid-teens. Expression of RP in all forms of inheritance varies considerably even between siblings. Female carriers of the X-linked form can show fundus changes and somewhat abnormal ERGs.
 Fig. 14. Fundus photo of patient with carrier X-linked retinitis pigmentosa |
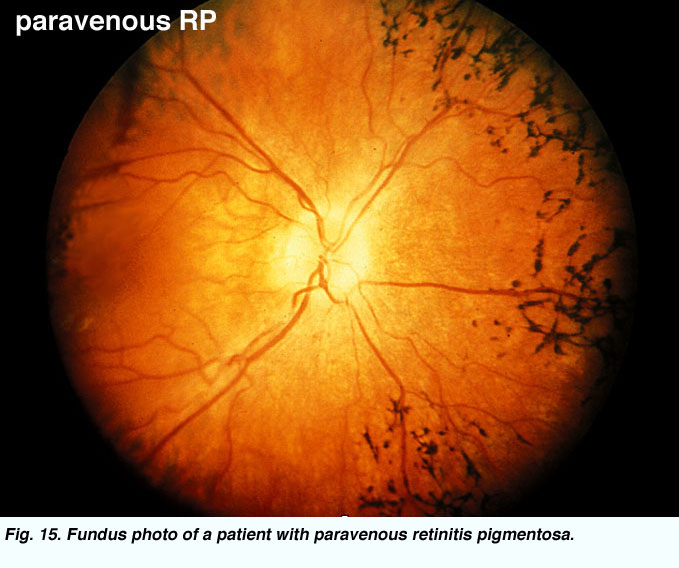 Fig. 15. Fundus photo of a patient with paravenous retinitis pigmentosa |
Atypical cases of RP are common. There are occasional cases of RP without the usual pigment changes in the fundus (retinitis pigmentosa sine pigmento). Often these cases represent early stages of the disease. Sector retinitis pigmentosa usually results in a subnormal ERG proportional to the area of retina involved. Paravenous retinitis pigmentosa (Fig. 15) is associated with a poor ERG most of the time but again, similar to sector RP, the ERG may be attenuated proportional to the extent of retinal involvement.
RP is seen as a component of a number of syndromes with variability in expression. A common syndrome is Usher’s. Usher’s syndrome is congenital deafness plus RP. Usher’s syndrome may comprise over 20% of RP cases not associated with other syndromes (Boughman and Fishman, 1983).
Myotonic dystrophy (MD) can show ocular changes similar to RP (Fig. 16). Even without fundus changes the ERG in MD patients is usually moderately affected like that seen in early dominantly inherited RP (Creel et al. 1985). It is interesting to note that minimally affected individuals without neurological symptoms usually have significant attenuation of their dim flash scotopic ERG b-wave amplitudes. Thus the ERG can be used to identify the minimally affected parent with MD (Fig. 16, the mother) in cases where neither parent of a child with myotonic dystrophy exhibits neurological symptoms.

Fig. 16 ERG of a family with a child with myotonic dystrophy
There are a number of central nervous system syndromes with RP-like ocular involvement. Prominent among these are the mucopolysaccharidoses such as the Hurler, Scheie and Hunter syndromes, which often have abnormal ERGs early in the disease. Another group is the neuronal ceroid lipofuscinoses such as Batten’s disease which have abnormal ERGs, usually attenuated b-waves.
There are syndromes that may include retinitis pigmentosa. The following list summarizes many of these syndromes:
Alagille syndrome: ERG normal or subnormal
Albers-Schonberg syndrome (osteopetrosis): ERG often abnormal
Alport’s syndrome: ERG normal or subnormal
Alstrom’s syndrome: ERG abnormal
Ataxia with isolated vitamin E deficiency (AVED) and RP: ERG abnormal
Bassen-Kornzweig syndrome (a-beta-lipoproteinemia): ERG abnormal
Cockayne’s syndrome: ERG often abnormal
Cystinosis: ERG abnormal in older children
Flynn-Ard syndrome: ERG sometimes abnormal
Friedreich’s ataxia: ERG sometimes abnormal
Hallervorden-Spatz syndrome: ERG often abnormal
Infantile phytanic acid storage disease: ERG usually abnormal
Jeune’s syndrome: ERG usually abnormal
Joubert’s syndrome: ERG abnormal
Kearn’s-Sayres syndrome: ERG some abnormal
Laurence-Moon-Bardet-Biedl syndrome: ERG usually abnormal
Methlmalonic aciduria with homocystinuria: ERG some abnormal
Mucopolysaccharidoses:Hurler; Scheie; Hunter: ERG often has b-wave attenuation
Myotonic dystrophy: ERG abnormal, dim scotopic ERGs
Neuronal ceroid lipofuscinosis:
Haltia-Sanavouri; Jansky-Bielschowsky; Batten’s: ERG often has b-wave attenuation
Neuropathy ataxia and retinitis pigmentosa (NARP): ERG abnormal
Refsum’s disease : ERG often abnormal
Saldino-Merzbacher syndrome: ERG usually abnormal
Senior-Loken syndrome: ERG usually abnormal
Spinocerebellar atrophy Type 7 (SPA7): ERG abnormal
Usher’s syndrome: ERG abnormal
Zellweger’s syndrome: ERG usually abnormal
In the differential diagnosis of retinitis pigmentosa there are a number of disorders in which the ERG can be used to distinguish the correct diagnosis. Pigment in the retina is prominent in many infectious diseases and may not solely be an indication of retinitis pigmentosa. Syphilis, particularly the congenital form, can mimic the fundus appearance of RP (Fig. 17 illustrates late-stage syphilis). In rubella and early stages of syphilis the ERG is usually normal or only slightly subnormal.
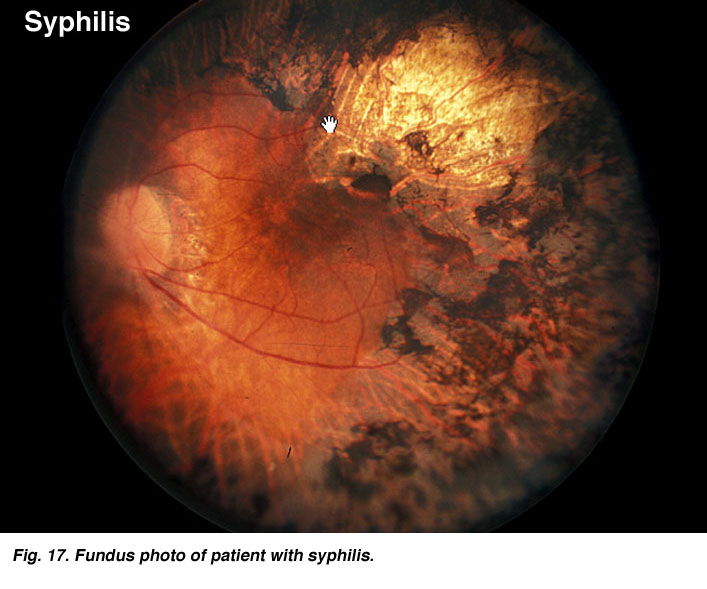 Fig. 17. Fundus photo of patient with syphilis |
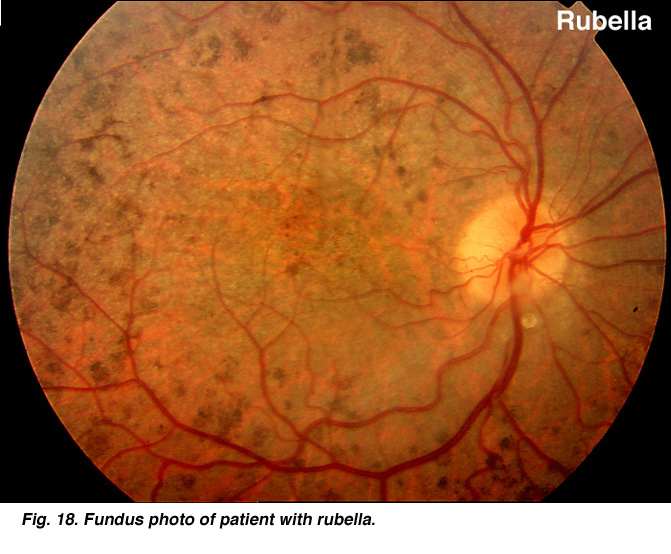 Fig. 18. Fundus photo of patient with rubella |
Rubella and viral infections such as mumps, measles, and herpes can produce pigment changes in the retina (Fig. 18). These ERGs are usually normal.
Stationary rod dystrophies
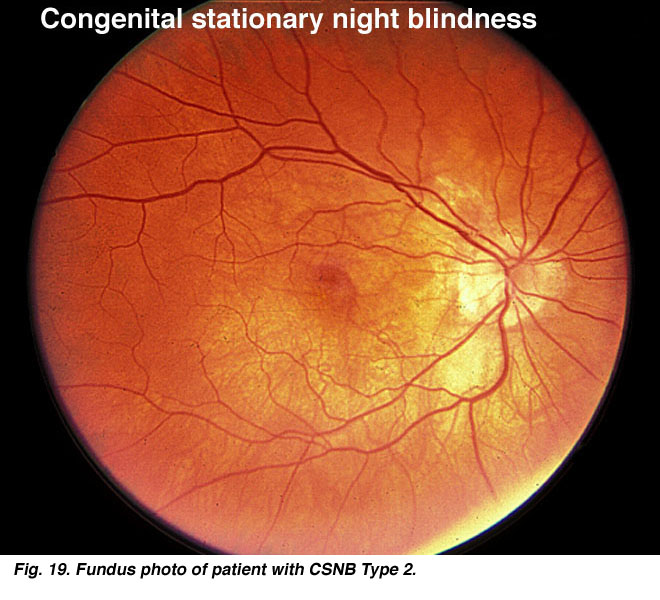
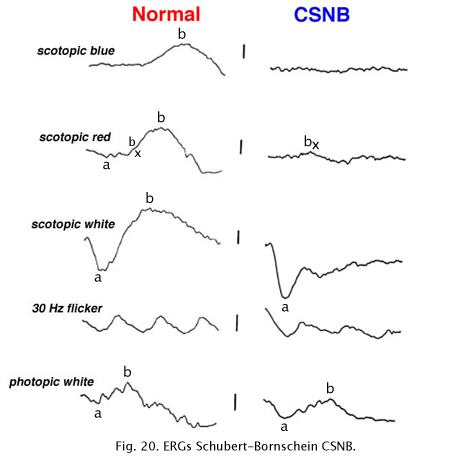
Congenital stationary night blindness (CSNB) is heterogeneous and found in several forms. There are more than 10 known loci including most forms of inheritance. CSNB is more often seen in a form with a normal appearing retina. There are several types. Schubert-Bornschein CSNB (X-linked, Xp11) is associated with decreased visual acuity, myopia, and nystagmus whereas patients with Riggs type CSNB have visual acuity within the normal range and no symptoms of myopia and/or nystagmus (locus 15q22). The Schubert-Bornschein type can vary in ERG appearance but the classic form has reduced b-wave amplitudes (Figs. 19 and 20). Note the abnormal dim scotopic ERG, and that the bright flash scotopic ERGs have a large a-wave and no b-wave (Fig. 20). Oscillatory potentials are also missing. In the Riggs type CSNB the a- and b-wave ERG amplitudes attenuate proportional to degree of expression.
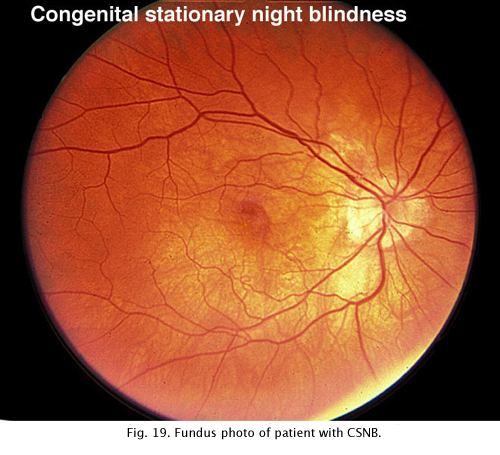 Fig. 19. Fundus photo of patient with CSNB Type 2 |
 Fig. 20. ERGs in a patient with CSNB Type 2 |
CSNB with retinal lesions is rare. Oguchi’s disease is CSNB with an unusual golden to rust coloration of the fundus that is reversed with long dark adaptation. This is called Mizuo-Nakamura phenomenon (Fig. 19b) and requires 2-3 hours of dark adaptation for fundus to change to a normal appearance. The ERG resembles classic CSNB with no b-wave although cases have been reported that the ERG returns to normal after hours of dark adaptation. Another rare form of night blindness is stationary albipunctate degeneration also referred to as fundus albipunctata. This disorder includes stationary night blindness with white dots scattered throughout the fundus (Fig. 19c). The ERG b-wave is attenuated but returns to normal after long dark adaptation. A third rare form is Kandori’s syndrome characterized by large irregular hyperfluorescent flecks in the peripheral and central retina. The ERG is similarly affected as in stationary albipunctate degeneration.
Enhanced S-cone syndrome, sometimes called Goldman-Favre syndrome, is a retinal disorder characterized by poor rod, and red and green cone function, increased sensitivity to blue light, night blindness from an early age, and decreased vision. Enhanced S-cone syndrome is the only retinal disorder that has an increase of a subtype of photoreceptors; in this case the S-cones (short wave length) that detect blue light. See S-Cone Pathways chapter by Helga Kolb in Webvision. Rod photoreceptors and red and green cone receptors are degenerated to a variable degree. ERGs show a poor rod photoreceptor response and increased ERG responses to blue flashes.
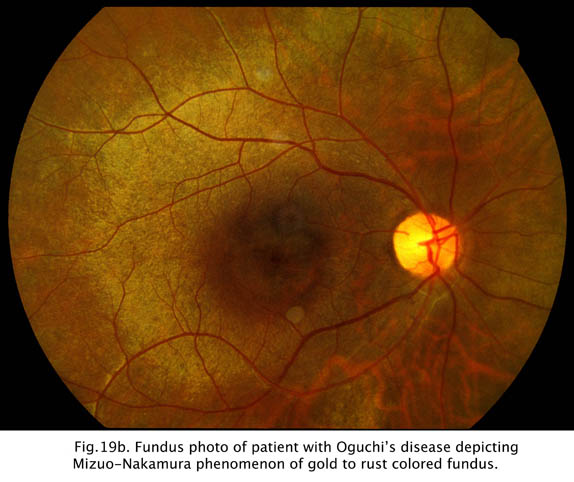

Fig 19c. Fundus photo of patient with Fundus Albipunctatus.
Other retinal atrophies
The bright flash ERG b-wave is selectively attenuated in:
Juvenile retinoschisis
Coat’s disease
Central retinal vein occlusion and central retinal artery occlusion
Myotonic dystrophy
Congenital stationary night blindness Type 2
Oguchi’s disease
Lipopigment storage diseases (Batten’s disease)
Creutzfeldt-Jacob (CJD)
Choroideremia represents an X-linked diffuse atrophy of the choroid and pigment epithelium. In its mature form the fundus appearance is white to yellow-white with some small islands of choroid (Fig. 21). Carriers are asymptomatic except for more subtle peripheral fundus abnormalities (Fig. 22). ERGs are usually abnormal.
 Fig. 21. Fundus photo of patient with Choroideremia |
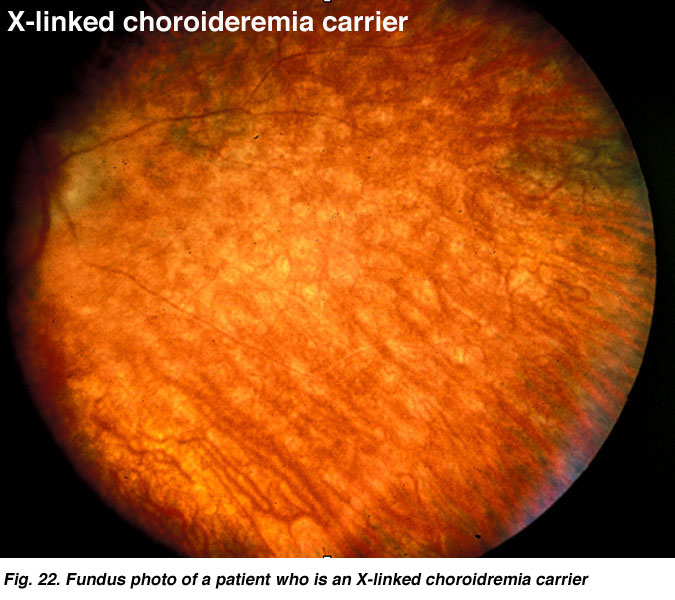 Fig. 22. Fundus photo of a patient with X-linked choroideremia carrier |
Gyrate atrophy (Fig. 23) is a recessively inherited atrophy of the pigment epithelium and choroid caused by a deficient mitochondrial enzyme ornithine aminotransferase (OAT).
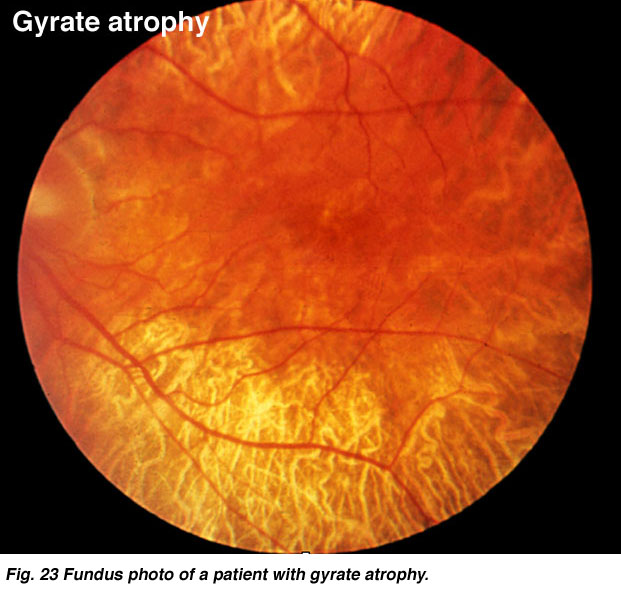
Fig. 23 Fundus photo of a patient with gyrate atrophy
Gyrate atrophy is less extensive than choroideremia and the fundus usually shows scalloped borders to degenerative areas (Fig. 23). ERGs are abnormal and progressly deteriorate according to the extent of degeneration of retinal pigment.
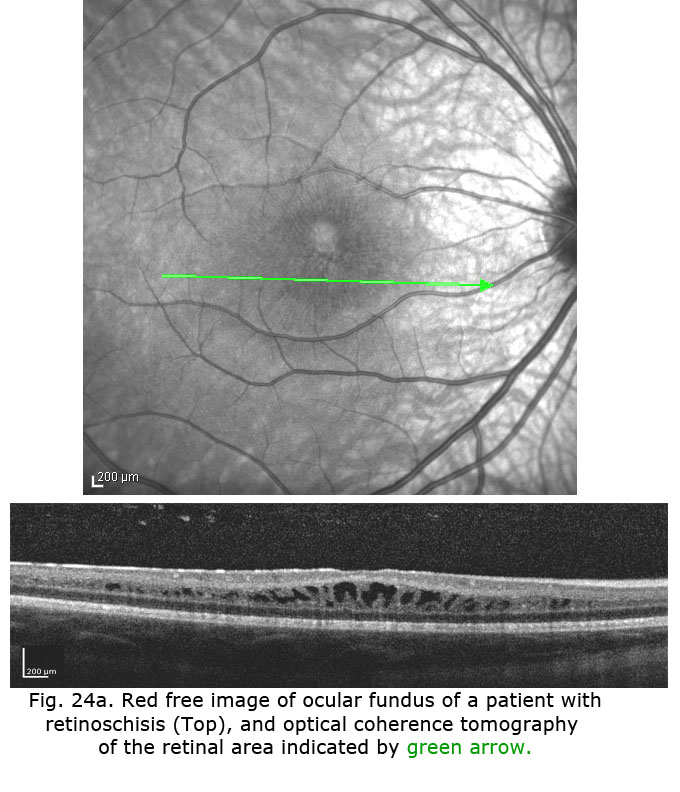
X-linked juvenile retinoschisis is a splitting or schisis in the central retina with a characteristic fundus appearance (Fig. 24). These patients have poor acuity. The ERG has a specific abnormality showing a normal a-wave but no b-wave. It is a negative ERG (Fig. 24). The picture is similar to that recorded in central retinal artery occlusion and Congenital Stationary Night Blindness Type 2. The splitting of the retina in retinoschisis can be seen in the OCT (Fig. 24a).

Fig. 24 Fundus photo and bright flash ERG of patient with retinoschisis
Patients with Creutzfeldt-Jakob disease (CJD) can also show selective loss of the b-wave (Katz et al. 2000) even in early stages. We have followed several patients with CJD that have shown unusual ERG waveforms. Similar in appearance to the ERGs of retinoschisis, the b-wave is greatly attenuated. In later stages the a-wave and oscillatory potentials are also affected. This pattern is seen in very few disorders, principally X-linked retinoschisis and congenital stationary night blindness type 2.
Except for some retinal dystrophies such as patients with severe retinitis pigmentosa or Leber’s congenital amaurosis, most retinal disorders produce reduced, “graded” amplitude attenuation of the ERG as we have seen in the above cases.
However, a few disorders result in a completely extinguished ERG. They include the following:
1) Leber’s congenital amaurosis
2) Severe retinitis pigmentosa
3) Retinal aplasia
4) Total detachment of retina
5) Ophthalmic artery occlusion
Leber’s congenital amaurosis unfortunately presents with significant visual loss in the first year after birth. The fundus usually has a salt and pepper appearance. The ERGs are usually unrecordable.
8. The ERG in cone dystrophies.
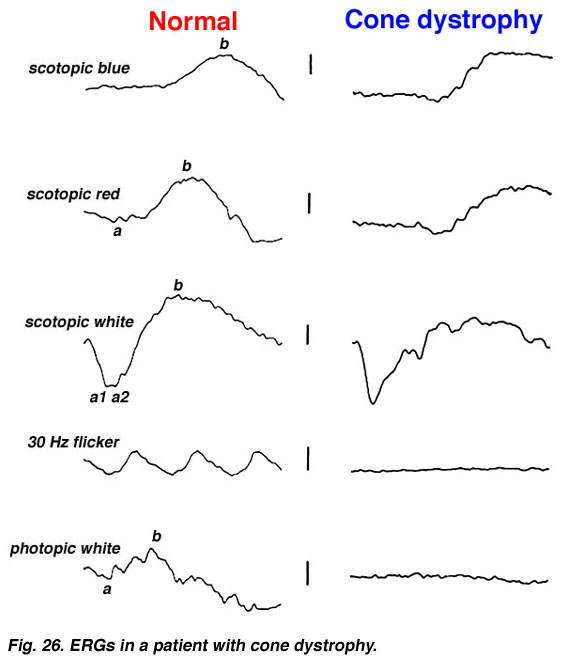
Full-field ERGs are best for quantifying cone dystrophy. The fovea contains about 200,000 cones and the central 1-degree of the fovea is rod-free. Cones dominate the macula, but far more cones are present outside the macula so a full-field ERG best assesses overall cone function. The full-field ERG offers three stimulus conditions to quantitate cone function. The normal scotopic dim red flash ERG includes the bx component appearing prior to the slow, large amplitude b-wave. The bx component occurs in form and time about the same as a photopic single white flash ERG. The bx is usually missing in a person with a cone dystrophy. Additionally cone function is quantified by the photopic single white flash and 30 Hz flicker following ERGs that are attenuated to the degree of expression of cone dystrophies.
In contrast to retinitis pigmentosa, the ERGs of a patient with a cone dystrophy exhibit good rod b-waves that are just slower. However, the early “cone” portion (bx) of the scotopic red flash ERG is missing. The scotopic bright white ERG is fairly normal in appearance but with slow implicit times. The 30 Hz flicker and photopic white ERGs dependent upon cones are very poor. Cone dystrophies are inherited in all forms and include poor color vision and poor acuity. The most common fundus findings are a “bullseye” appearance or diffuse pigmentation in the macular area (Fig. 25). Many patients have nystagmus and photophobia. Cone-rod dystrophy appears to involve only cones early in the disease, later the ERGs usually show attenuated rod physiology. (Fig. 26).
 Fig. 25. Fundus photo of patient with cone dystrophy |
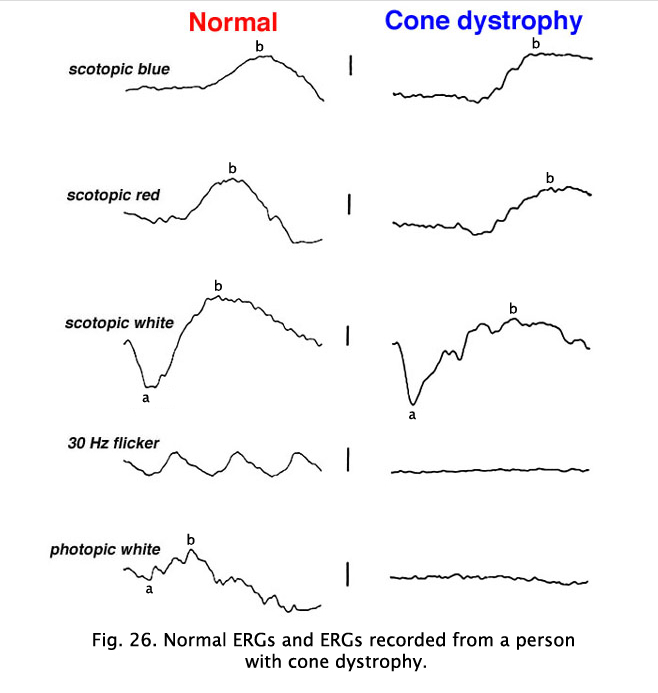 Fig. 26. ERGs in a patient with cone dystrophy |
There are a number of genetic loci associated with achromatopsia. Scotopic rod ERGs are usually normal or only slightly reduced in amplitude, but photopic, and cone ERG performance, including 30 Hz flicker following is poor. Similar to many retinal diseases an OCT of the foveal area can help confirm diagnosis.
Other dystrophies are the flecked retina disorders, such as fundus flavimaculatus (Fig. 27) and Stargardt’s disease (Fig. 27b). The retinas display an abnormal accumulation of lipofuscin. Full-field ERGs in these disorders are normal except in very late stages where full-field ERGs may become slightly subnormal. Macular multifocal ERGs are dramatically abnormal.
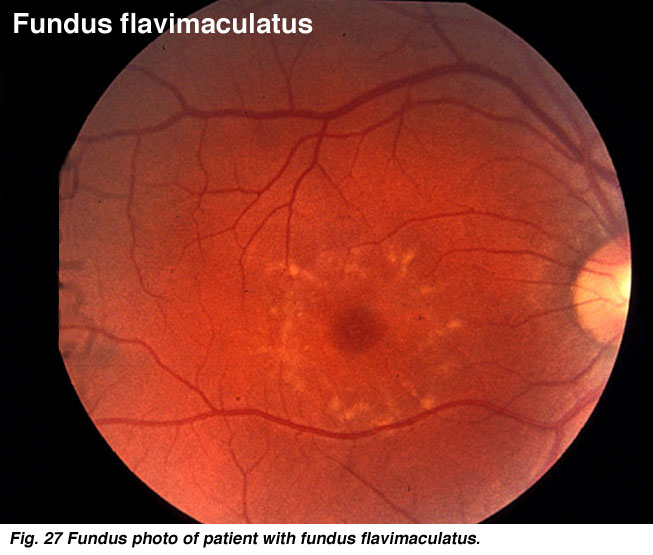
Fig. 27 Fundus photo of patient with fundus flavimaculatus

Fig. 27b Fundus photo of patient with Stargardt’s disease
9. ERGs in retinal vascular disease.
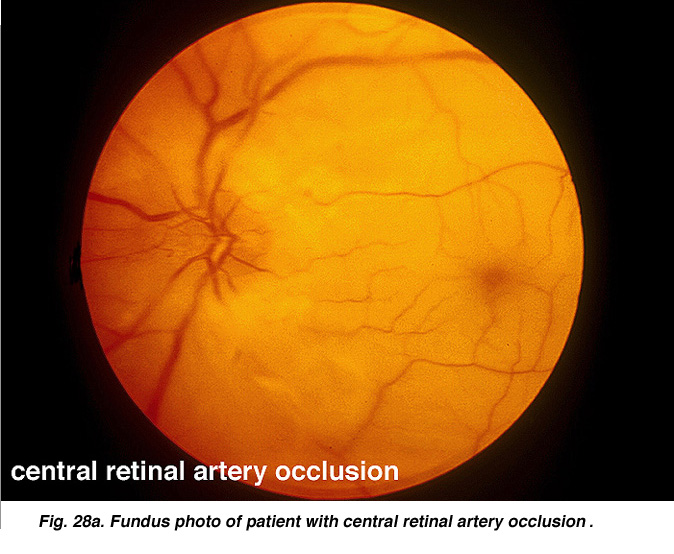
Vascular occlusions such as central retinal artery thrombosis produce a characteristic avascular appearance to select areas of the fundus (Fig. 28a) and an ERG with no b-wave (Fig. 28b). Ophthalmic artery occlusions usually result in unrecordable ERGs. In general, focal disease including due to vascular insufficiency, detachment, trauma, or focal toxicity reduces the full-field ERG amplitude proportional to amount of area affected.
 Fig. 28a. Fundus photo of patient with central retinal artery occlusion Fig. 28a. Fundus photo of patient with central retinal artery occlusion |
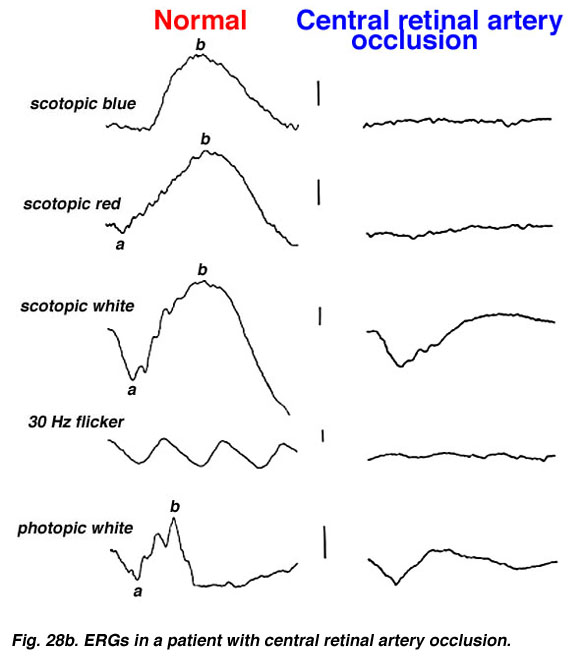 Fig. 28b. ERGs in a patient with central retinal artery occlusion |
The most significant ERG changes associated with central retinal vein occlusion are attenuation of b-wave amplitude and delay in 30 Hz flicker implicit time to beyond 35 milliseconds.
10. Foreign bodies and Trauma
The ERG is useful to assess cases of retinal foreign bodies and trauma to estimate the extent of retinal dysfunction. Foreign bodies affect retinal function depending on the extent of trauma to the retina, the location and composition of the object.
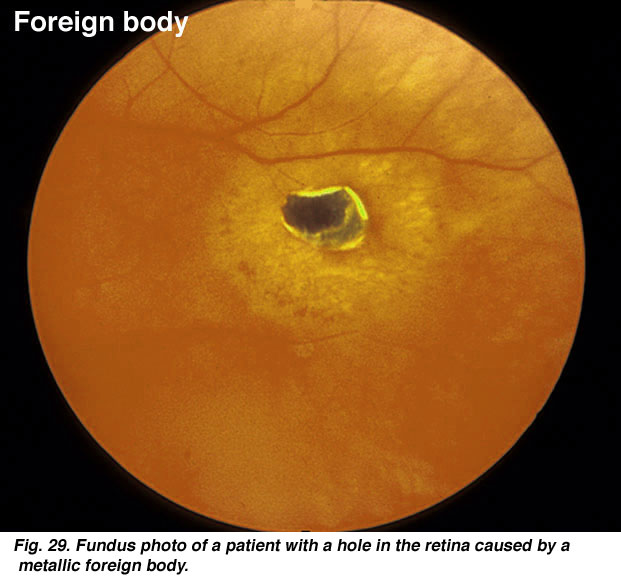
Fig. 29 Fundus photo of a patient with a hole in the retina caused by a metallic foreign body
A small piece of stainless steel or plastic outside the macula may have a minor affect on the retina. However a piece of copper or iron (Fig. 29) would likely have deleterious affects within a few weeks (Figs. 30a and 30b). In general if b-wave amplitudes are reduced 50% or greater compared to the fellow eye, it is unlikely that the retinal physiology will recover unless the foreign body is removed.
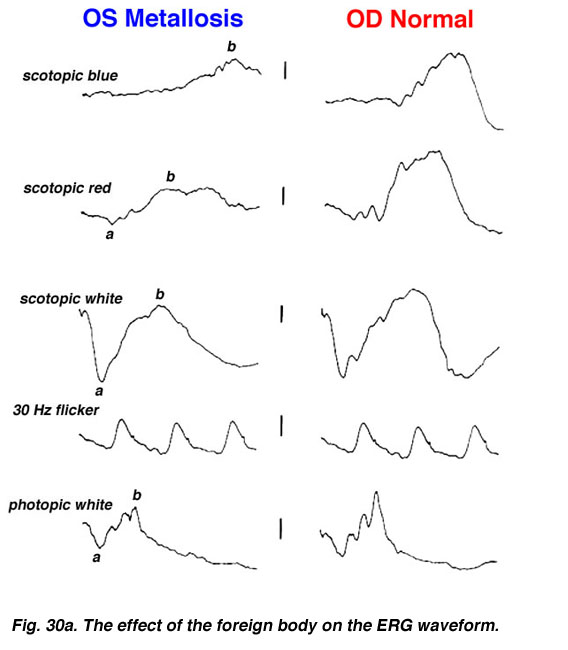 Fig. 30a. The effect of the foreign body on the ERG waveform |
 Fig. 30b. The effect of the foreign body on the ERG waveform some weeks later |
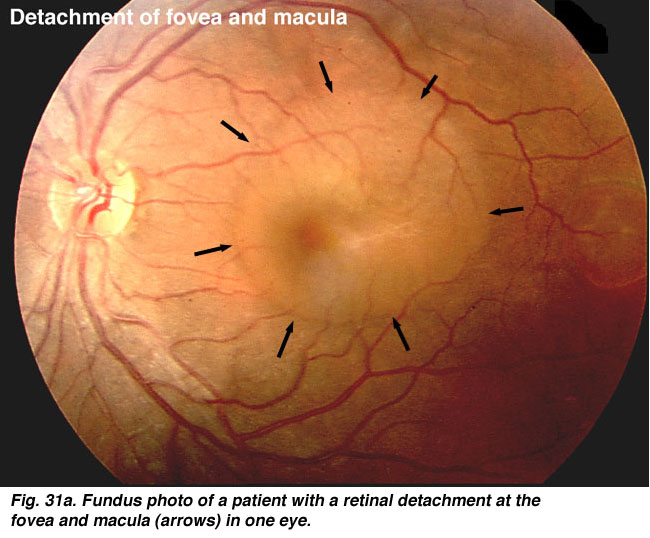
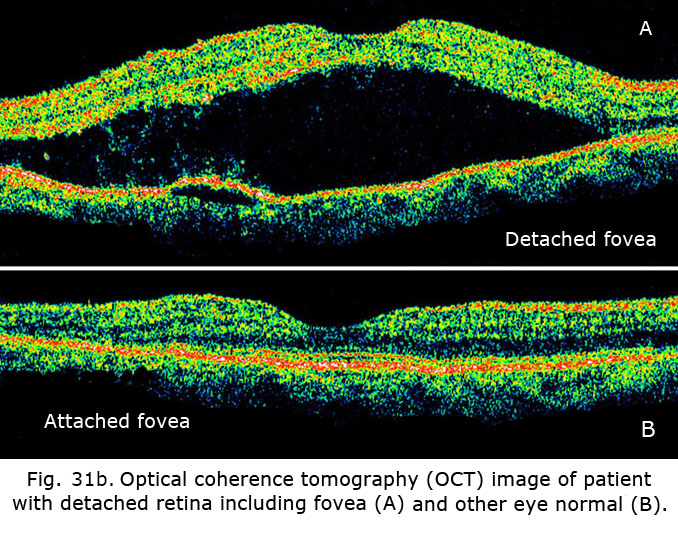
The ERG can be used to estimate the extent of functional retina in cases of retinal detachment. An interesting case is shown in figures 31a and 31b. The patient had a small retinal detachment of the macular area in one eye (Fig. 31a, arrows point to circle of detachment). Viewing the retina using optical coherence tomography (OCT), which gives an optical image like a vertical section plane, the detached portion of the retina in the foveal and macular area can be clearly seen in comparison to the normal attached macular area in the fellow eye. In general ERG b-wave amplitudes correspond to the amount of attached healthy retina, although the detached retina may function for some time.
11. Drug toxicities.
Several drugs taken in high doses or for long periods of time can cause retinal degeneration with pigmentary changes. Culprits include thioridazine (Mellaril; Novartis, withdrawn from market worldwide 2005), chlorpromazine (Thorazine; GlaxoSmithKline, and generic formulations), Vigabatrin (aka gamma-vinyl-GABA: Sabril; Lundbeck, and generic formulations), and chloroquine and hydroxychloroquine (Plaquenil; Sanofi, and generic formulations).
The effects of toxic medications can be detected and quantified using ERGs. Which type of ERG to apply depends on the mechanism and site of retinal toxicity.
Chloroquine retinopathy appears as a characteristic “bullseye” maculopathy (Fig. 32). The full-field ERGs may become abnormal in these cases (Fig. 33). The better substitute for chloroquine, Plaquenil, can also have macular effects noticeable by multifocal electroretinograms (see later section on mfERGs).
To detect chloroquine toxicity, the American Academy of Ophthalmology recommends performing fundus examinations, 10-2 automated visual fields, and at least one objective test: multifocal electroretinography, fundus autofluorescence imaging, or spectral-domain optical coherence tomography (SD-OCT) (Marmor et al., 2011). By contrast, Amsler grid testing, color vision testing, fluorescein angiography, full-field ERG, and electro-oculogram are not considered to be helpful (Michaelides et al., 2011; Costedoat-Chalumeau, et al., 2012).
The American Academy of Ophthalmology guidelines recommend a baseline examination for patients starting these drugs to serve as a reference point; and to rule out maculopathy an annual screening after 5 years of use unless there is suspicion of toxicity or presence of unusual risk factors. I recommend obtaining a screening mfERG within 4 to 6 months of starting medication to detect patients susceptible to toxicity, such as the patient’s mfERGs illustrated on left side of Figure 48. Consider that elderly patients can be more susceptible to toxicity, as can those with kidney or liver disease, and those with retinal disease.
Vigabatrin, a pediatric seizure medication, can be toxic to the retina. Attenuation of full-field ERG b-wave amplitudes can detect toxicity. Often the first indication of toxicity is reduced amplitude to 30 Hz flicker following.
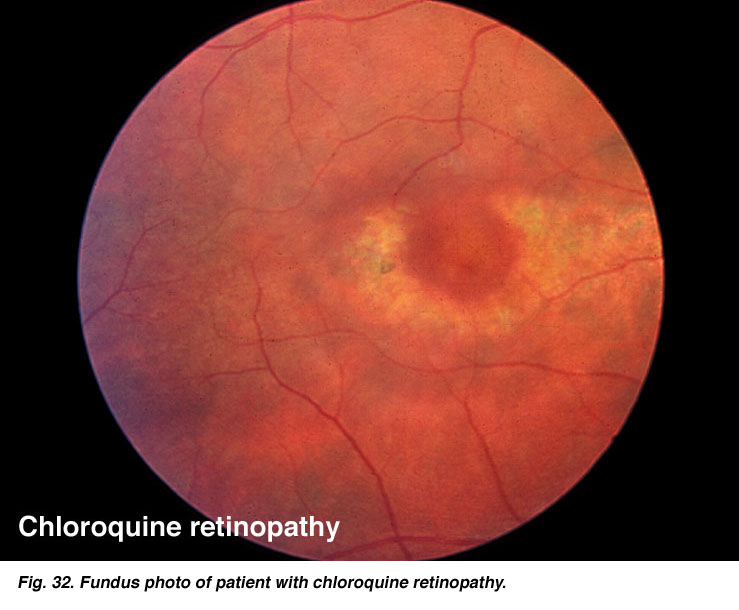 Fig. 32. Fundus photo of patient with chloroquine retinopathy |
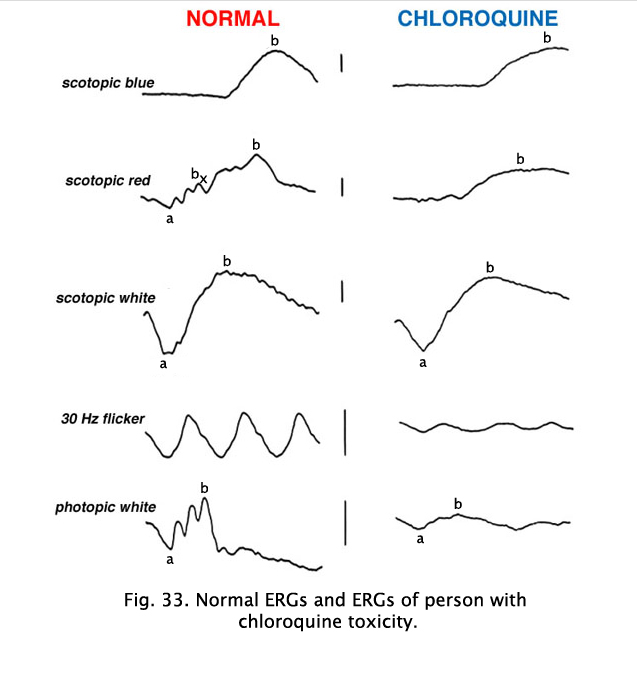 Fig. 33. ERGs in a patient with chloroquine retinopathy |
Hydroxychloroquine (Plaquenil) is usually less disruptive to the retina than chloroquine, but ERG changes can still occur. Other drugs can end up being accidentally toxic to the retina. Cis-platinum used to treat brain tumors sometimes reaches ophthalmic vascularization (Fig. 34) and causes a reduction in ERG waveform in the affected eye (OD in this case) (Fig. 35).
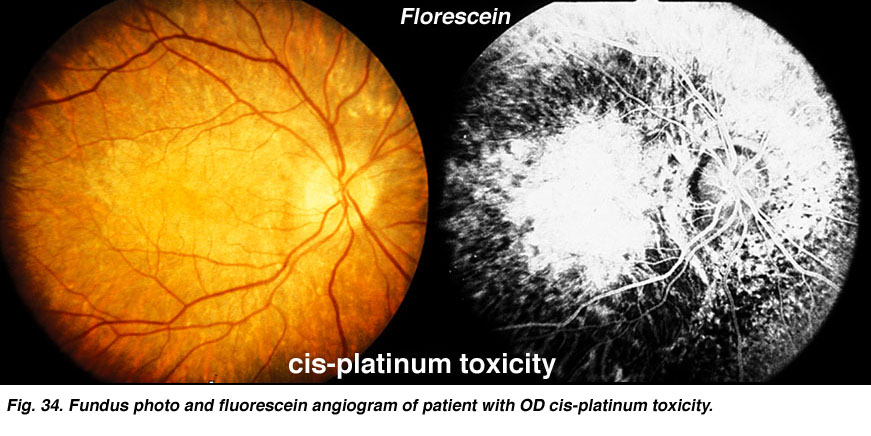
Fig. 34 Fundus photo of patient with OD cis-platinum toxicity
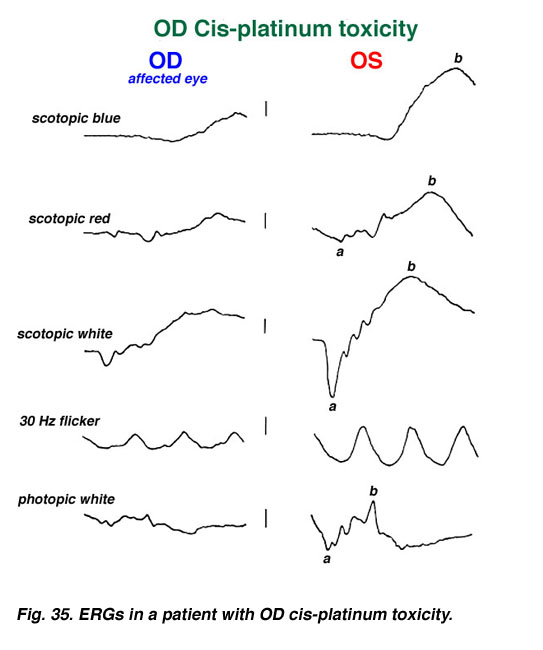
Fig. 35 ERGs in a patient with OD cis-platinum toxicity
An interesting case was seen in our clinic, where an intranasal steroid injection affected the retina of the patient’s right eye (OD) only. The fundus photo shows a cherry red spot in the macula (Fig. 36). The ERG response was diminished in size particularly following dim scotopic flashes (Fig. 37).
 Fig. 36. Fundus photo of patient with steroid retinopathy |
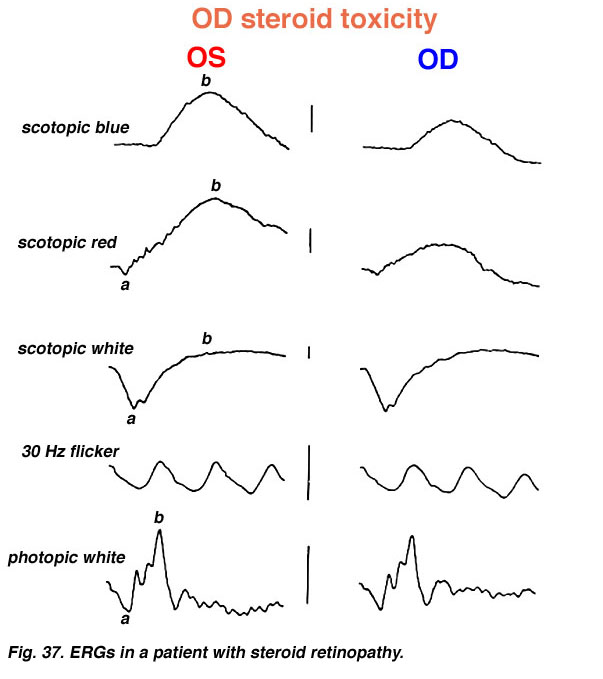 Fig. 37. ERGs in a patient with steroid retinopathy |
Talc retinopathy is also seen occasionally (Fig. 38). Again the global ERG is attenuated in such cases (Fig. 39).
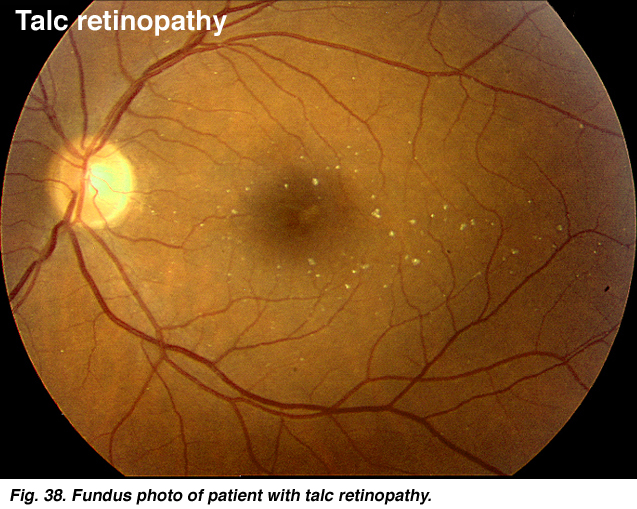 Fig. 38. Fundus photo of patient with talc retinopathy |
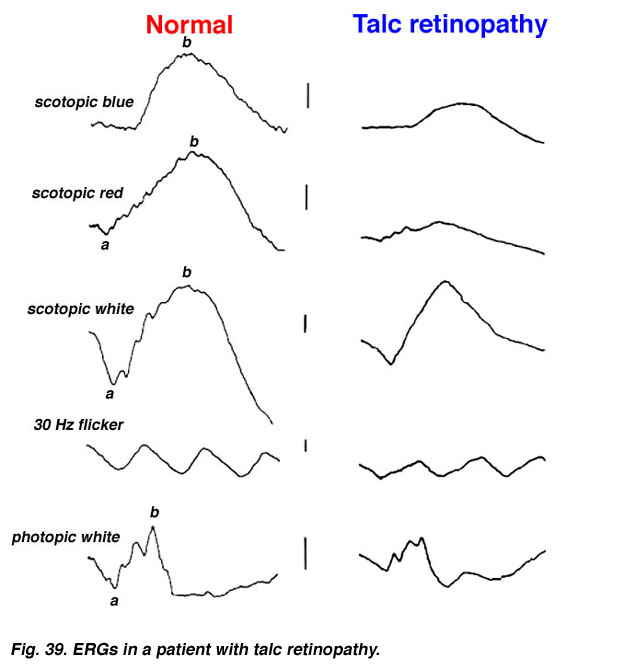 Fig. 39. ERGs in a patient with talc retinopathy |
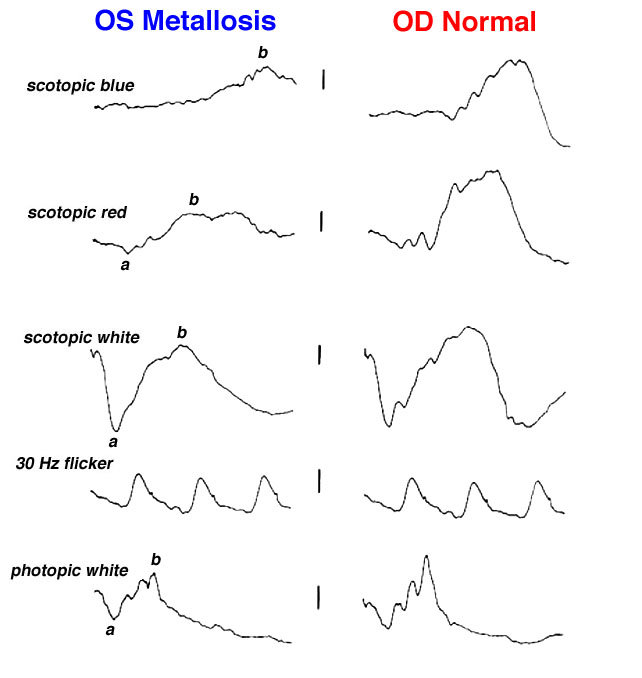
Cobalt or chromium retinal toxicity is an occasionally appears due to the large number of cobalt-chromium alloy prostheses used for joint replacement. Ocular, cardiac, nervous system, and endocrine abnormalities have been reported in association with implant-related toxicity. Full-field electroretinograms can show decreased b-wave amplitudes. Scotopic dim blue and red flash ERGs best demonstrate the attenuated ERGs.
12. Systemic disorders and the ERG.
Systemic metabolic disorders are reflected in retinal physiology. Liver and kidney disease and drugs that affect those organ systems, usually reduce ERG b-wave amplitudes, particularly in scotopic dim flash ERGs. For example, deferoxamine, an iron chelating drug used to reduce iron overload, can be toxic to the retina. This is reflected in reduced a- and b-waves of the ERG (Fig. 40).
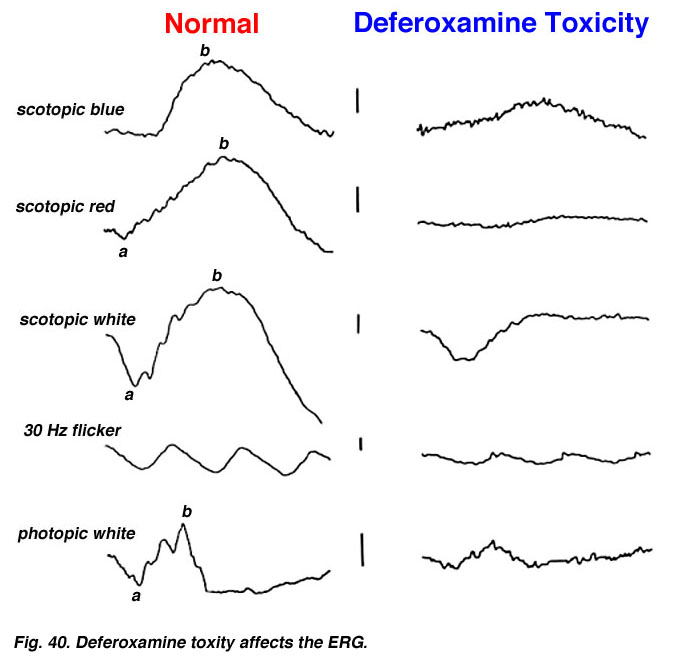
Fig. 40. Deferoxamine toxity affects on the ERG
The estrogen antagonist Tamoxifen is primarily used in the management of metastatic breast adenocarcinoma. Toxicity in the form of retinal crystals may be asymptomatic or may cause mild central visual impairment along with dyschromatopsia. These latter visual symptoms generally occur secondary to development of cystoid macular edema (CME). Both full-field and multifocal ERGs suggest Tamoxifen is rarely toxic at low dose levels. Canthaxanthin is a carotenoid pigment used in vitiligo and photosensitivity disorders. Ocular abnormalities are rarely seen when canthaxanthin is used to treat these conditions. Toxicity is characterized by an asymptomatic ring of yellow-orange crystals in the macular region. Minor ERG changes have been reported but few long lasting visual effects.
An 80-year-old male experienced drop in acuity from 20/25 to 20/50 and poor night vision coincident with successful cataract removal and intraocular lens implantation. Ocular fundus exam was normal. The electroretinograms shown in Figure 40a reminded me of a past patient with failing liver and reduced small bowel. Further medical history revealed mystery patient has 130 cm of small bowel remaining, and coincidentally had stopped taking daily multiple vitamins. Patient Vitamin A level was 0.13 mg/L. After 30 days Vitamin A supplementation his ERGs returned to near normal for age (Fig. 40b) and acuity improved to 20/30. For more detailed discussion of effects of vitamin A deficiency on ERGs see McBain et al. (2007).

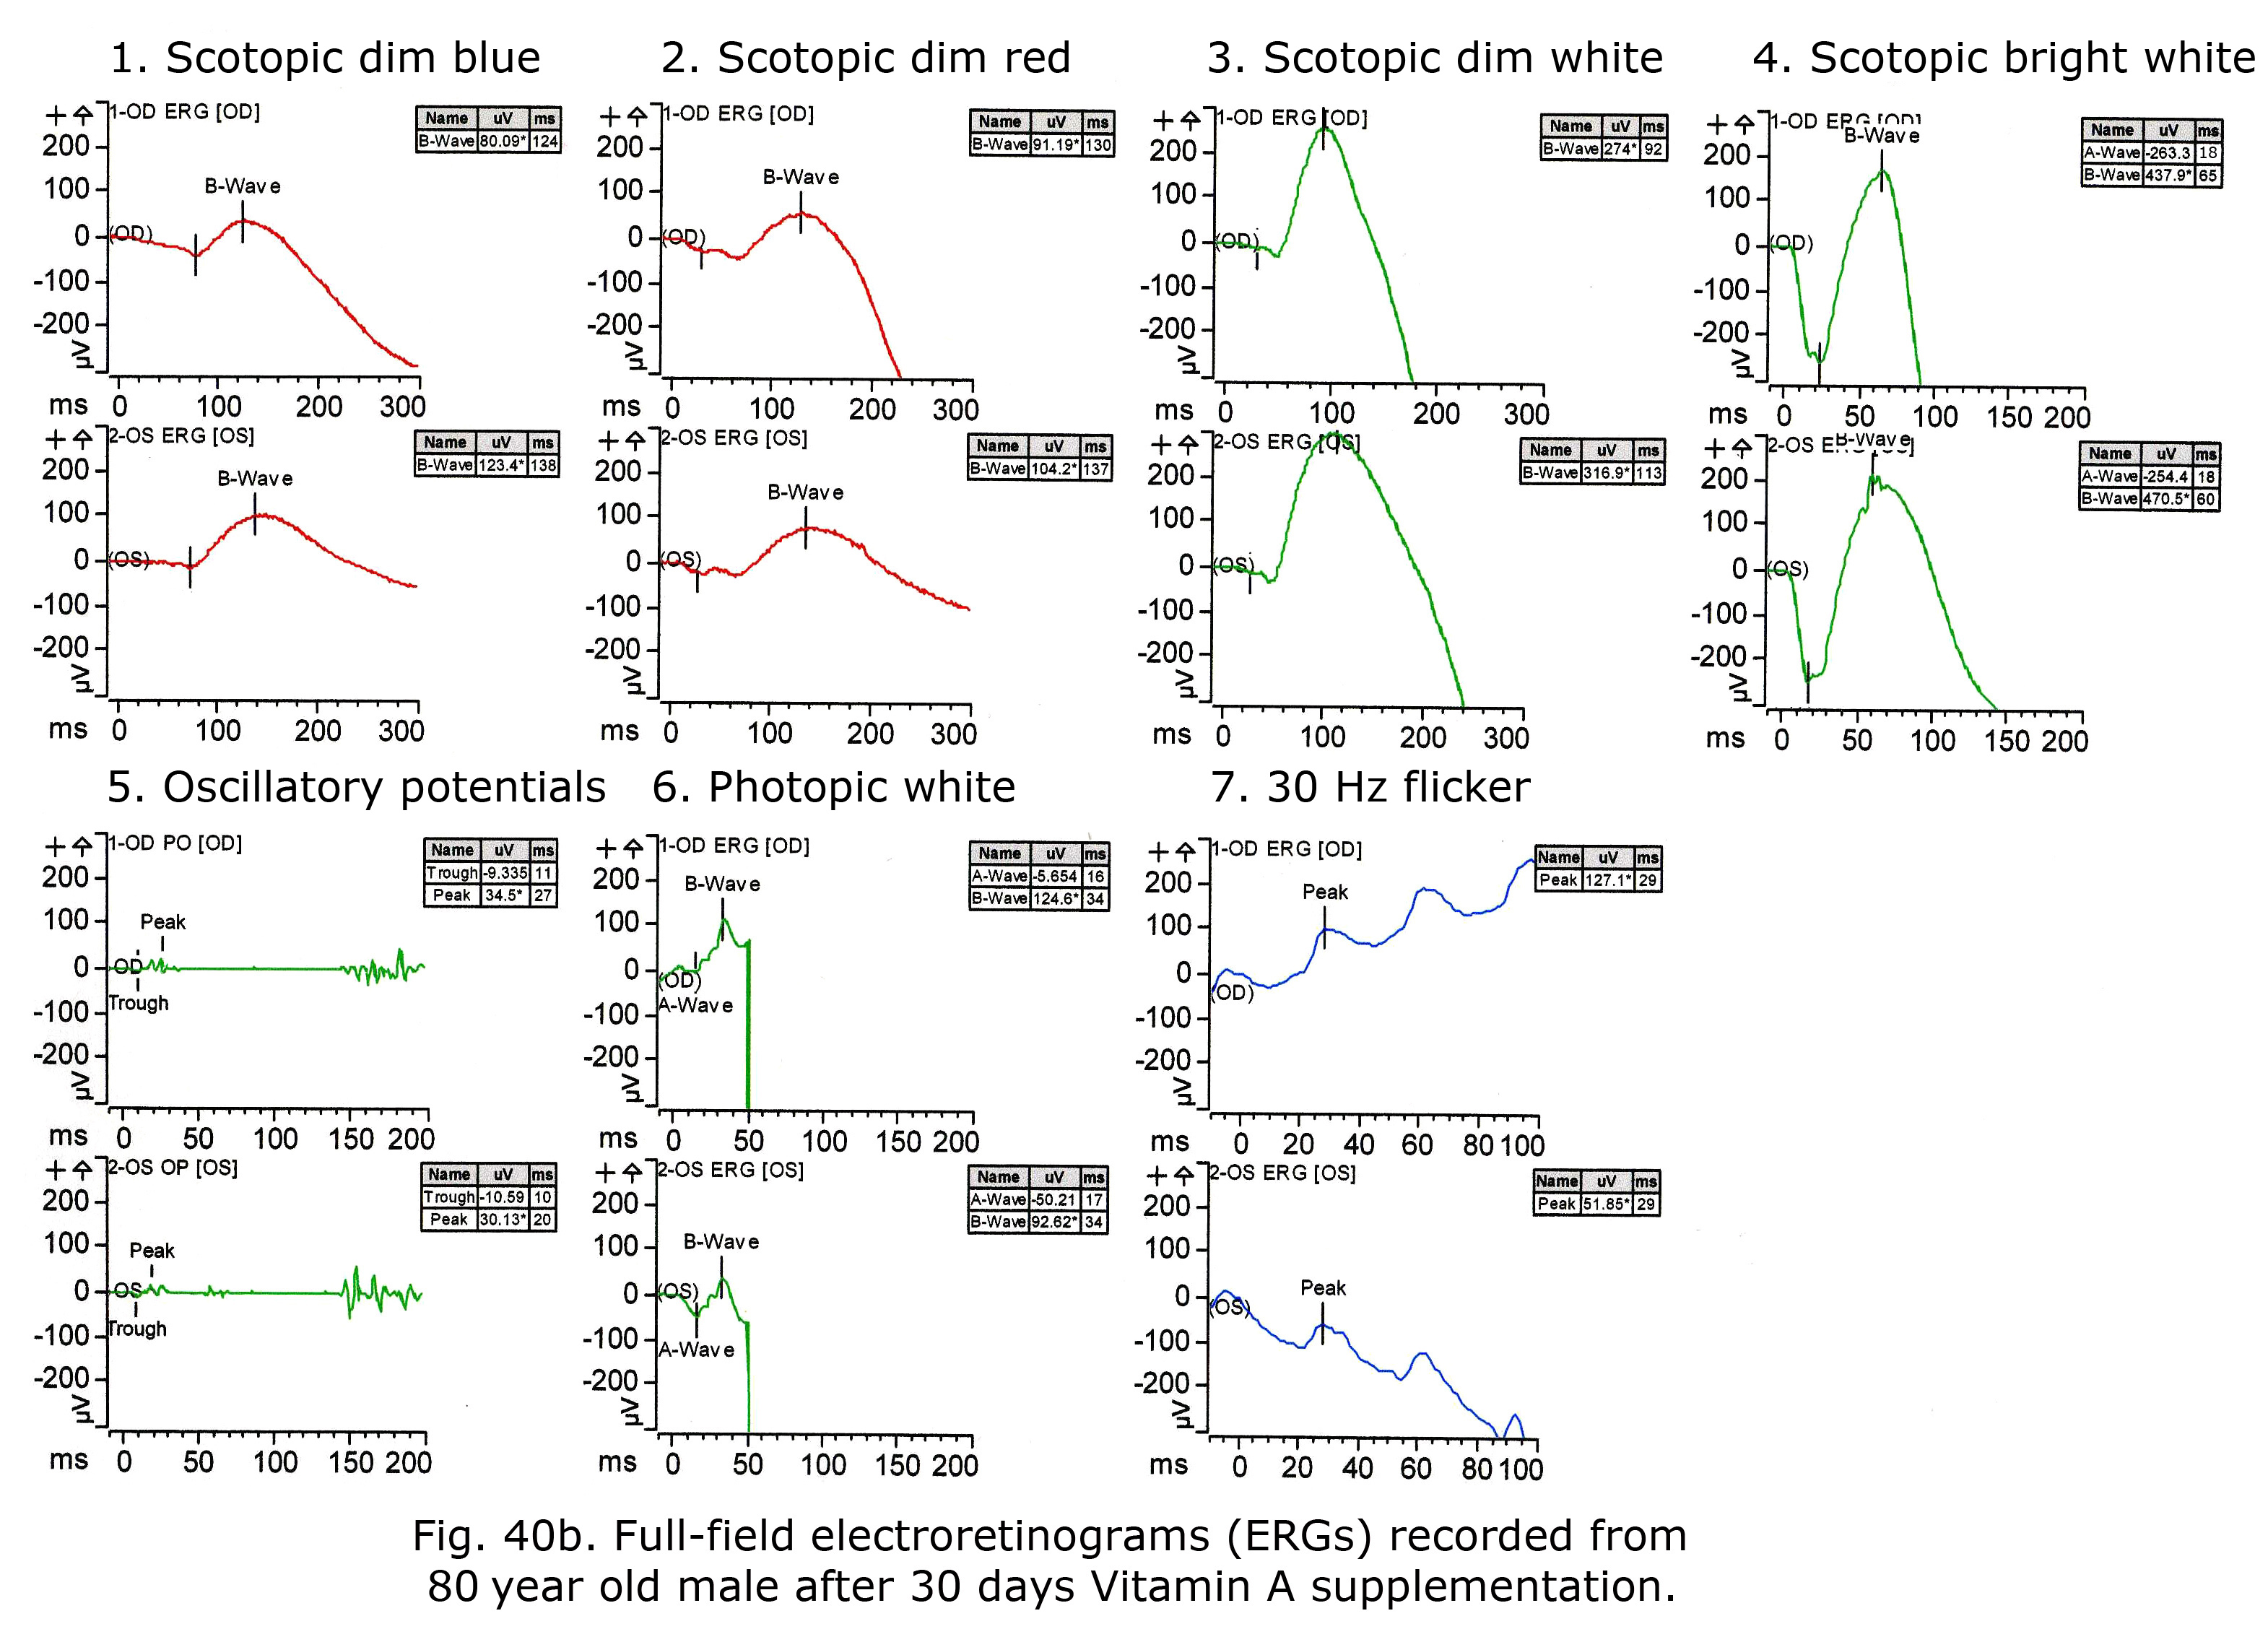
Notably, cone physiology survives vitamin A deficiency significantly better than rod physiology. In Figure 40a photopic, single flash and 30 Hz flicker ERGs were nearly normal whereas scotopic dim flash rod ERGs were unrecordable. The molecular mechanisms within rods and cones responsible for this difference are not entirely clear, but early measurements of the rate of rod and cone pigment regeneration in the human eye performed by Rushton and Henry (1968) demonstrated that cones regenerate their bleached pigment at a rate much faster than rods. By virtue of this difference in regeneration rate, it was supposed that cones depleted the chromophore 11-cis retinal from the available pool in the inter photoreceptor matrix at a much faster rate, thus “stealing” chromophore from the rods. Under conditions of vitamin A deficiency, rods would be expected to have their sensitivity diminished compared to cones, as they lose their chromophore to the cones. To account for the difference in the rate of uptake of 11-cis retinal between cones and rods, it has been observed that there exist two visual cycles for pigment regeneration, one for rods and another primarily for cones (Tang et al., 2012; Ala-Laurila et al., 2009). The canonical rod visual cycle resides in the retinal pigment epithelium (RPE), the layer of tissue located adjacent to and behind the retina. The RPE supplies 11-cis retinal primarily to rods. Supply for the cones resides primarily in Müller cells located in the neural retina. This alternative visual cycle additionally supplies cones with 11-cis retinol, a retinoid that only cones can utilize for pigment regeneration. Cone physiology is also much faster than rod physiology in part due to the open outer segment plasma membrane in cones providing a much larger surface area than rods expediting the exchange of retinoids and ions.
Effects of cancer-associated retinopathy (CAR), melanoma-associated retinopathy (MAR) and autoimmune retinopathies can be quantified with full-field ERGs. Scotopic b-wave amplitudes are most dramatically affected and attenuation of b-wave amplitude is apparent earliest in the ERGs evoked by scotopic dim blue and red flash stimuli. Delayed cone b-wave implicit times with normal amplitudes have also been reported.
The mucopolysaccharidoses are part of the lysosomal storage disease family, a group of more than 40 genetic disorders. These disorders, including Hunter’s, Hurler, and Hurler-Scheie syndromes, can show reduced ERG b-wave amplitudes, which is some will continue to progress to more negative ERG form as disease progresses.
In mitochondrial retinopathies the ERG can show generalized reduced b-wave amplitudes. A pigmentary retinopathy may be present.
13. The multifocal ERG (mfERG).
A limitation of the traditional global or full-field ERG is that the recording is a massed potential from the whole retina. Unless 20% or more of the retina is affected with a diseased state the ERGs are usually normal. In other words a legally blind person with macular degeneration, enlarged blind spot or other small central scotomas will have a normal full-field ERG.
The most important development in ERGs is the multifocal ERG (mfERG). Erich Sutter adapted the mathematical sequences called binary m-sequences creating a program that can extract hundreds of focal ERGs from a single electrical signal. This system allows assessment of ERG activity in small areas of retina. With this method one can record mfERGs from hundreds of retinal areas in a several minutes (Sutter, 2010). ERG electrodes are used to record ERGs from the cornea from a dilated eye. Small scotomas in retina can be mapped and degree of retinal dysfunction quantified. See Hood et al. (2012) for recommended ISCEV International Standard mfERG protocol.
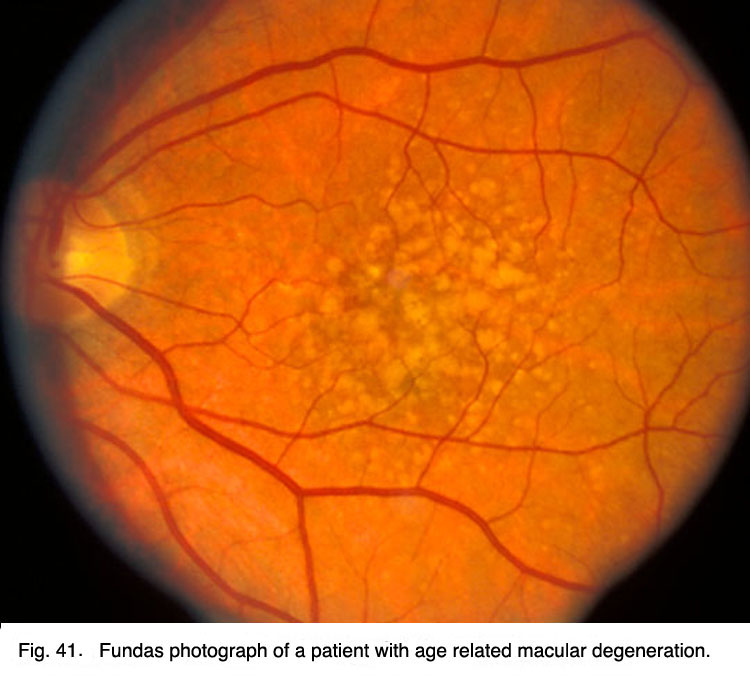
Below are the mfERGs of a patients tested at the Moran Eye Center. The first patient was an elderly woman with early macular degeneration. Figure 41 is the fundus photograph. In Figure 42 are 103 multifocal ERGs from approximately the central 40 degrees of retinal field. Figure 43 are the b-wave voltages from a patient with more severe expression of macular degeneration transformed into a color plot. Figure. 43 (lower right) shows a color plot of a normal person for comparison. The top color transformation is the difference between the patient’s multifocal ERGs and a normal group, which points out the worst areas of retinal function. Colors reflect standard deviations (S.D.) from average ERG amplitudes. These plots can be rotated from 3-D to 2-D so that they resemble visual field plots.
 Fig. 41. Fundus photograph of a patient with age related macular degeneration |


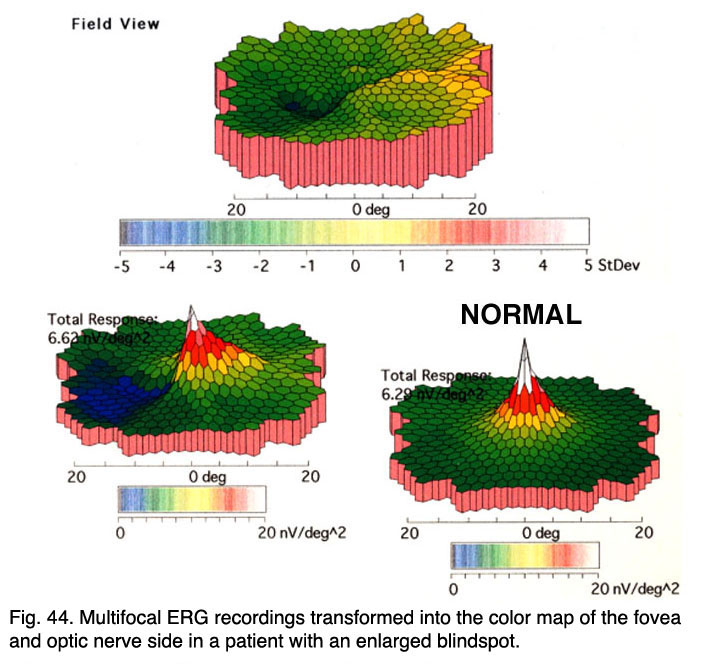
One of the best uses of mfERGs is for distinguishing between retinal and central etiology of visual problems in patients with no apparent abnormalities in the ocular fundus. These types of patients can include MEWDS (Multiple Evanescent White Dot Syndrome) and AZOOR (acute zonal occult outer retinopathy). Figure 44 is example of 17-year-old male diagnosed with AZOOR associated with a viral prodrome. The mfERGs are clearly showing the retinal abnormalities coincident with the visual field losses (Fig. 44). In contrast, the only visible fundus abnormalities were small, easily overlooked pinpoint hyperfluorescent lesions in Indocyanine Green Chorioangiography (ICG).

Most mfERG analyses are based on amplitude of the mathematical approximation of the “b-wave”. Implicit times can sometimes better describe progression of retinal diseases. An example is in retinal degeneration called birdshot retinochoroidopathy. Birdshot retinochoroidopathy is an uncommon disease usually seen in Caucasian females of northern European descent past the fourth decade of life (Vitale, 2013). Funduscopy reveals characteristic multifocal, hypopigmented, ovoid, cream-colored lesions (50-1500 µm) at the level of the choroid and RPE in the postequatorial fundus (Fig. 45, a). Typically lesions show a nasal and radial distribution, emanating from the optic nerve, and frequently they follow the underlying choroidal vessels (Fig. 45, a).

Indocyanine green (ICG) angiography reveals multiple hypofluorescent spots corresponding with birdshot lesions (Figs. 45, b). Full-field ERGs usually show characteristic 30 HZ flicker attenuation and prolonged photopic b-wave and 30 Hz implicit times. Full-field scotopic-b wave amplitudes are useful parameter to quantify general severity of expression. Multifocal ERG implicit times map the distribution of slow implicit times across the retina (Fig. 46). Normal “b-wave” implicit times are about 30 milliseconds. Sequential mfERGs performed over period of several years show progression across the retina. Both photos and mfERG implicit times in Figures 45 and 46 are from the left eye of the same patient.

A small number of medications can be toxic to the retina. Effects of toxic medications can be detected and quantified using electroretinography. Which type of electroretinogram to use depends on mechanism and site of retinal toxicity. Abnormalities associated with toxic drugs may be detected using appropriate electroretinographic stimuli. Choosing the appropriate visual stimuli will maximize detection of toxic effects. Quantifying retinal drug toxicity using multi-focal electroretinograms is a strong point of mfERGs.
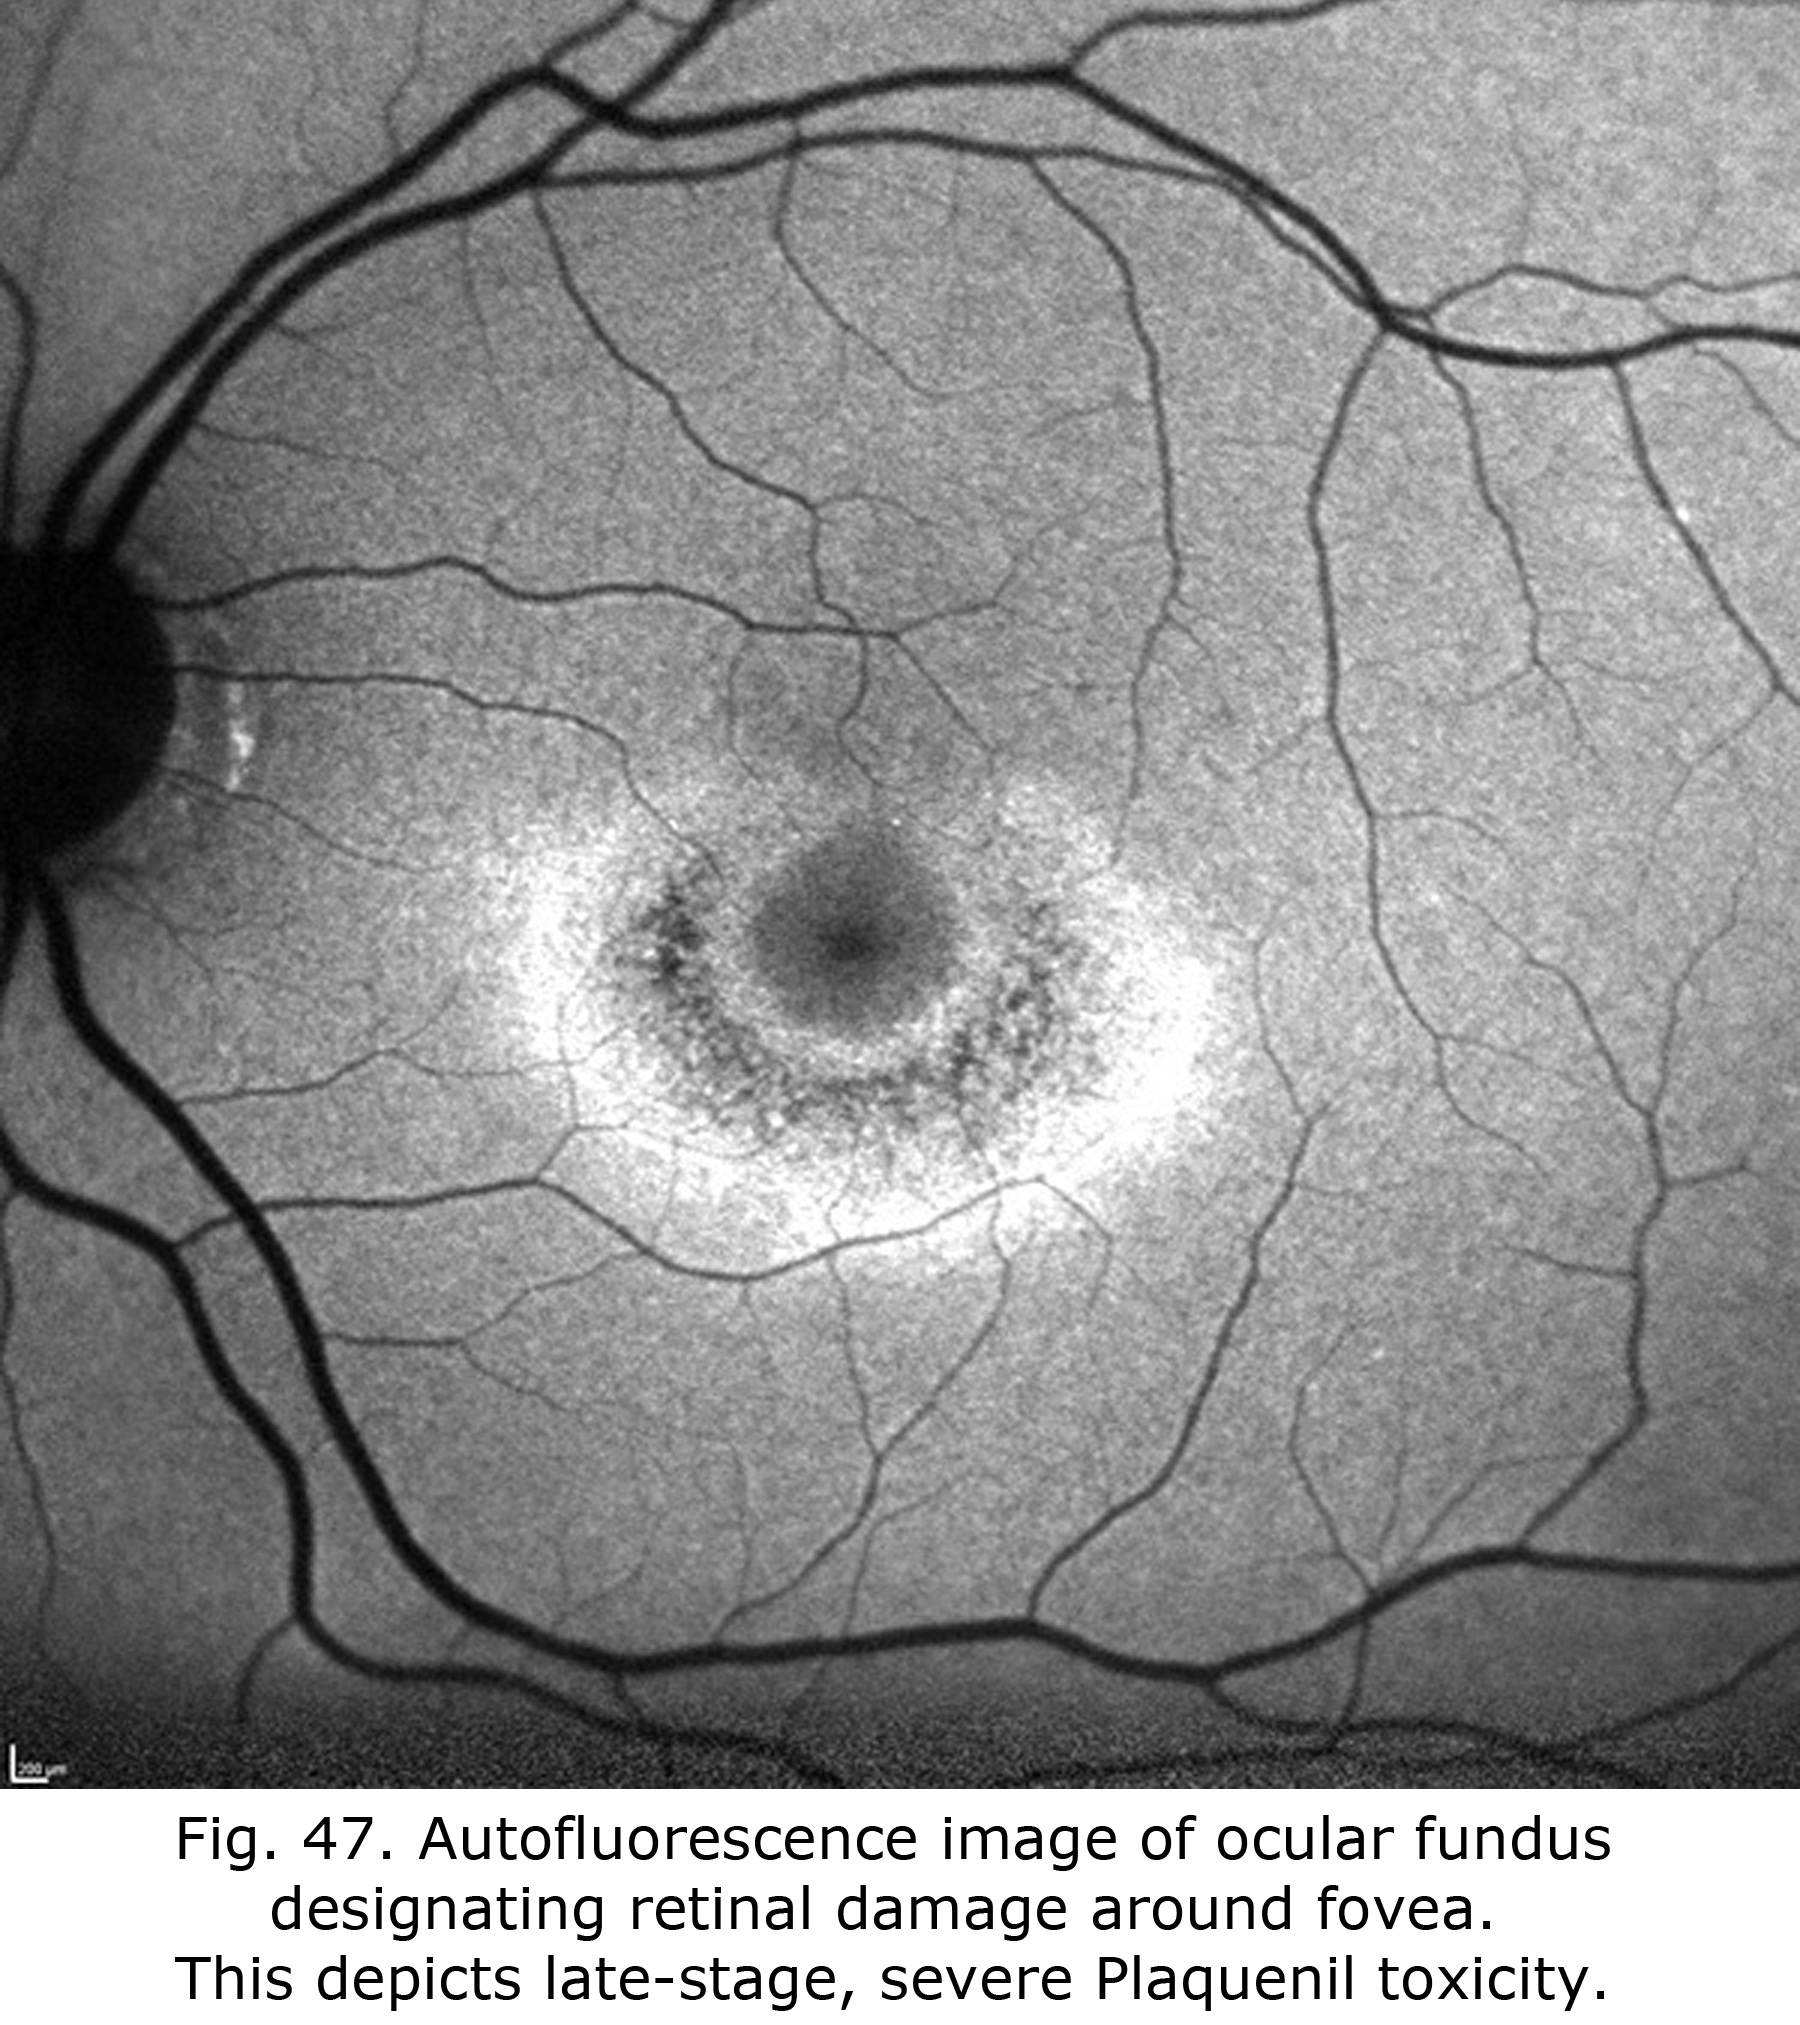
Antimalarials chloroquine, a 4-aminoquinoline, and Plaquenil, hydroxychloroquine, which is also used to treat discoid or systemic lupus erythematosus and rheumatoid arthritis, dermatological disorders, and Sjogren’s syndrome can be toxic to the retina producing ring scotomas. Multifocal ERGs better quantify retinal toxicity than full-field ERGs. Below are mfERGs of several patients with Plaquenil toxicity. Plaquenil first affects small areas between 5-15 degrees from fovea eventually progressing to produce a ring scotoma.(Figs. 47 and 48).

Ethambutol used to treat tuberculosis, and Navane a psychotropic agent can also produce macular toxicity detectable by mfERGs. Central macular mfERGs may be attenuated in amplitude.
I mentioned earlier in the full-field ERG section that flecked retina disorders, such as fundus flavimaculatus and Stargardt’s disease (Fig. 27b) show few ERG anomalies. However, mfERGs show significant central loss in patients with Stargardt’s disease (Fig. 49).
 Fig. 49. Multifocal ERG recordings in a patient with Stargart’s disease
14. The Electrooculogram EOG.
The electrooculogram measures the potential that exists between the cornea and Bruch’s membrane at the back of the eye. The potential produces a dipole field with the cornea approximately 5 millivolts positive compared to the back of the eye, in a normally illuminated room. Although the origin of the EOG is the pigment epithelium of the retina, the light rise of the potential requires both a normal pigment epithelium and normal mid-retinal function. Elwin Marg described and named the electrooculogram in 1951 and Geoffrey Arden (Arden et al. 1962) developed the first clinical application. With the cornea constantly positive, movement of the eye produces a shift of this electrical potential. By attaching skin electrodes on both sides of an an eye (Fig. 50) the potential can be measured by having the subject move his or her eyes horizontally a set distance (Fig. 51). The eyes are usually dilated. Skin electrodes are attached near the lateral and medial canthus of each eye (Fig. 50). A ground electrode is attached usually to either the forehead or earlobe. It is helpful that the patient have a chin rest to reduce head movement. Usually inside a Ganzfeld, or on a screen in front of the patient, small red fixation lights are place 30 degrees apart (Fig. 52). The distance the lights are separated is not critical for routine testing. Any set distance subtending from 20-40 degrees of visual angle is satisfactory. See Marmor et al. (2011) for recommended ISCEV International Standard EOG protocol.
 Fig. 50. Placement of the electrodes for recording an EOG Fig. 50. Placement of the electrodes for recording an EOG |
 Fig. 51. How the EOG potential is measured as the eyes turn towards and away from the skin electrodes |
The patient should be light adapted such as in an well-illuminated room, and eyes dilated. After the electrodes are attached the procedure is explained and the patient asked to practice several times while baseline data are recorded. The procedure is simple. The patient keeps his or her head still while moving the eyes back and forth alternating between the two red lights. The movement of the eyes produces a voltage swing of approximately 5 millivolts between the electrodes on each side of the eye, which is charted on graph paper or stored in the memory of a computer.

Fig. 52. Ganzfeld used for stimulating the EOG waveform
Below are 10-second periods of eye movement back and forth between two red LED lights placed 30 degrees apart inside a Ganzfeld (Fig. 53).

Fig. 53. Light adapted pre-EOG, dark adaption phase and light-rise phase
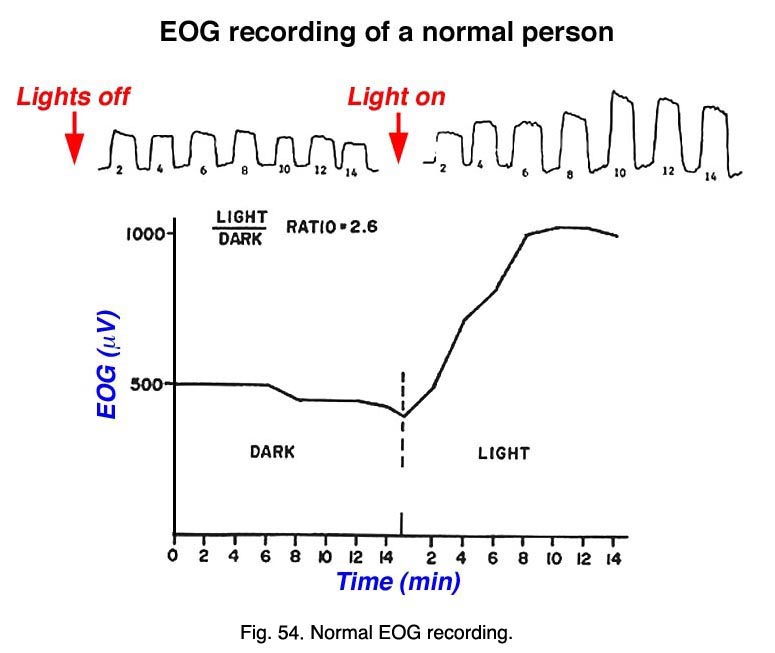
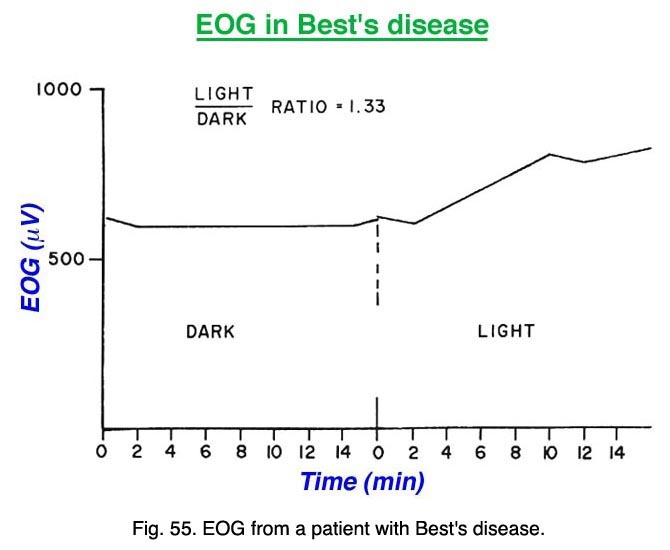
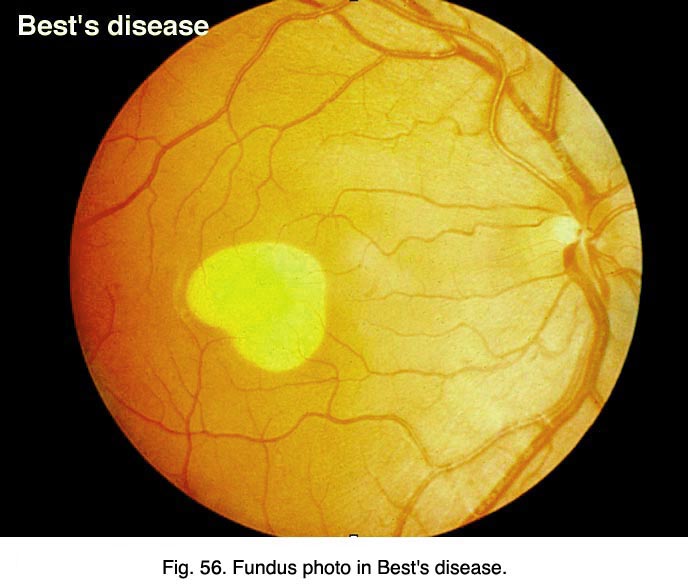
After training the patient in the eye movements, the lights are turned off. About every minute a sample of eye movement is taken as the patient is asked to look back and forth between the two lights (Fig. 52). Some laboratories have the patients move their eyes the entire testing period. After 15 minutes the lights are turned on and the patient is again asked about once a minute to move his or her eyes back and forth for about 10 seconds. Figure 53 shows segments of eye movement that have been cut from 10 second samples from a normal person. The chart (Fig. 54) graphs the change in voltage in the eye through 15 minutes of dark adaptation and 15 minutes of bright light. Typically the voltage becomes a little smaller in the dark reaching its lowest potential after about 8-12 minutes, the so-called “dark trough.” When the lights are turned on the potential rises, the light rise, reaching its peak in about 10 minutes. When the size of the “light peak” is compared to the “dark trough” the relative size should be about 2:1 or greater (Fig. 54). A light/dark ratio of less than 1.8 is considered abnormal for individuals less than 60 years, a ratio of less than 1.7 for over 60 years. Figure 55 shows a fundus photo from a patient with Best’s disease during the sunny side up egg yolk stage (See Fig 58 for stages).
.
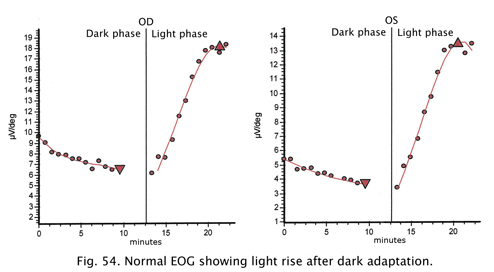 Fig. 54. Normal EOG recording |
 Fig. 55. Funds photo of a patient with Best’s disease |
Retinal diseases producing an abnormal EOG will usually have an abnormal ERG too which is the better test for analysis of scotopic and photopic measures. However, a particularly good use for the EOG is in following the affects of high dosage treatment with antimalarials such as chloroquine and plaquenil over the course of treatment and before the ERG is affected (Arden, Friedman and Kolb, 1962). The most common use of the EOG nowadays is to confirm Best’s disease. Best’s vitelliform macular dystrophy and variants of this disease are usually identified by the appearance of a retinal lesion resembling an egg yolk early in the disease (Fig. 56). There is considerable variation in the fundus appearance in Best’s disease.
 Fig. 56. Fundus photo in Best’s Disease |
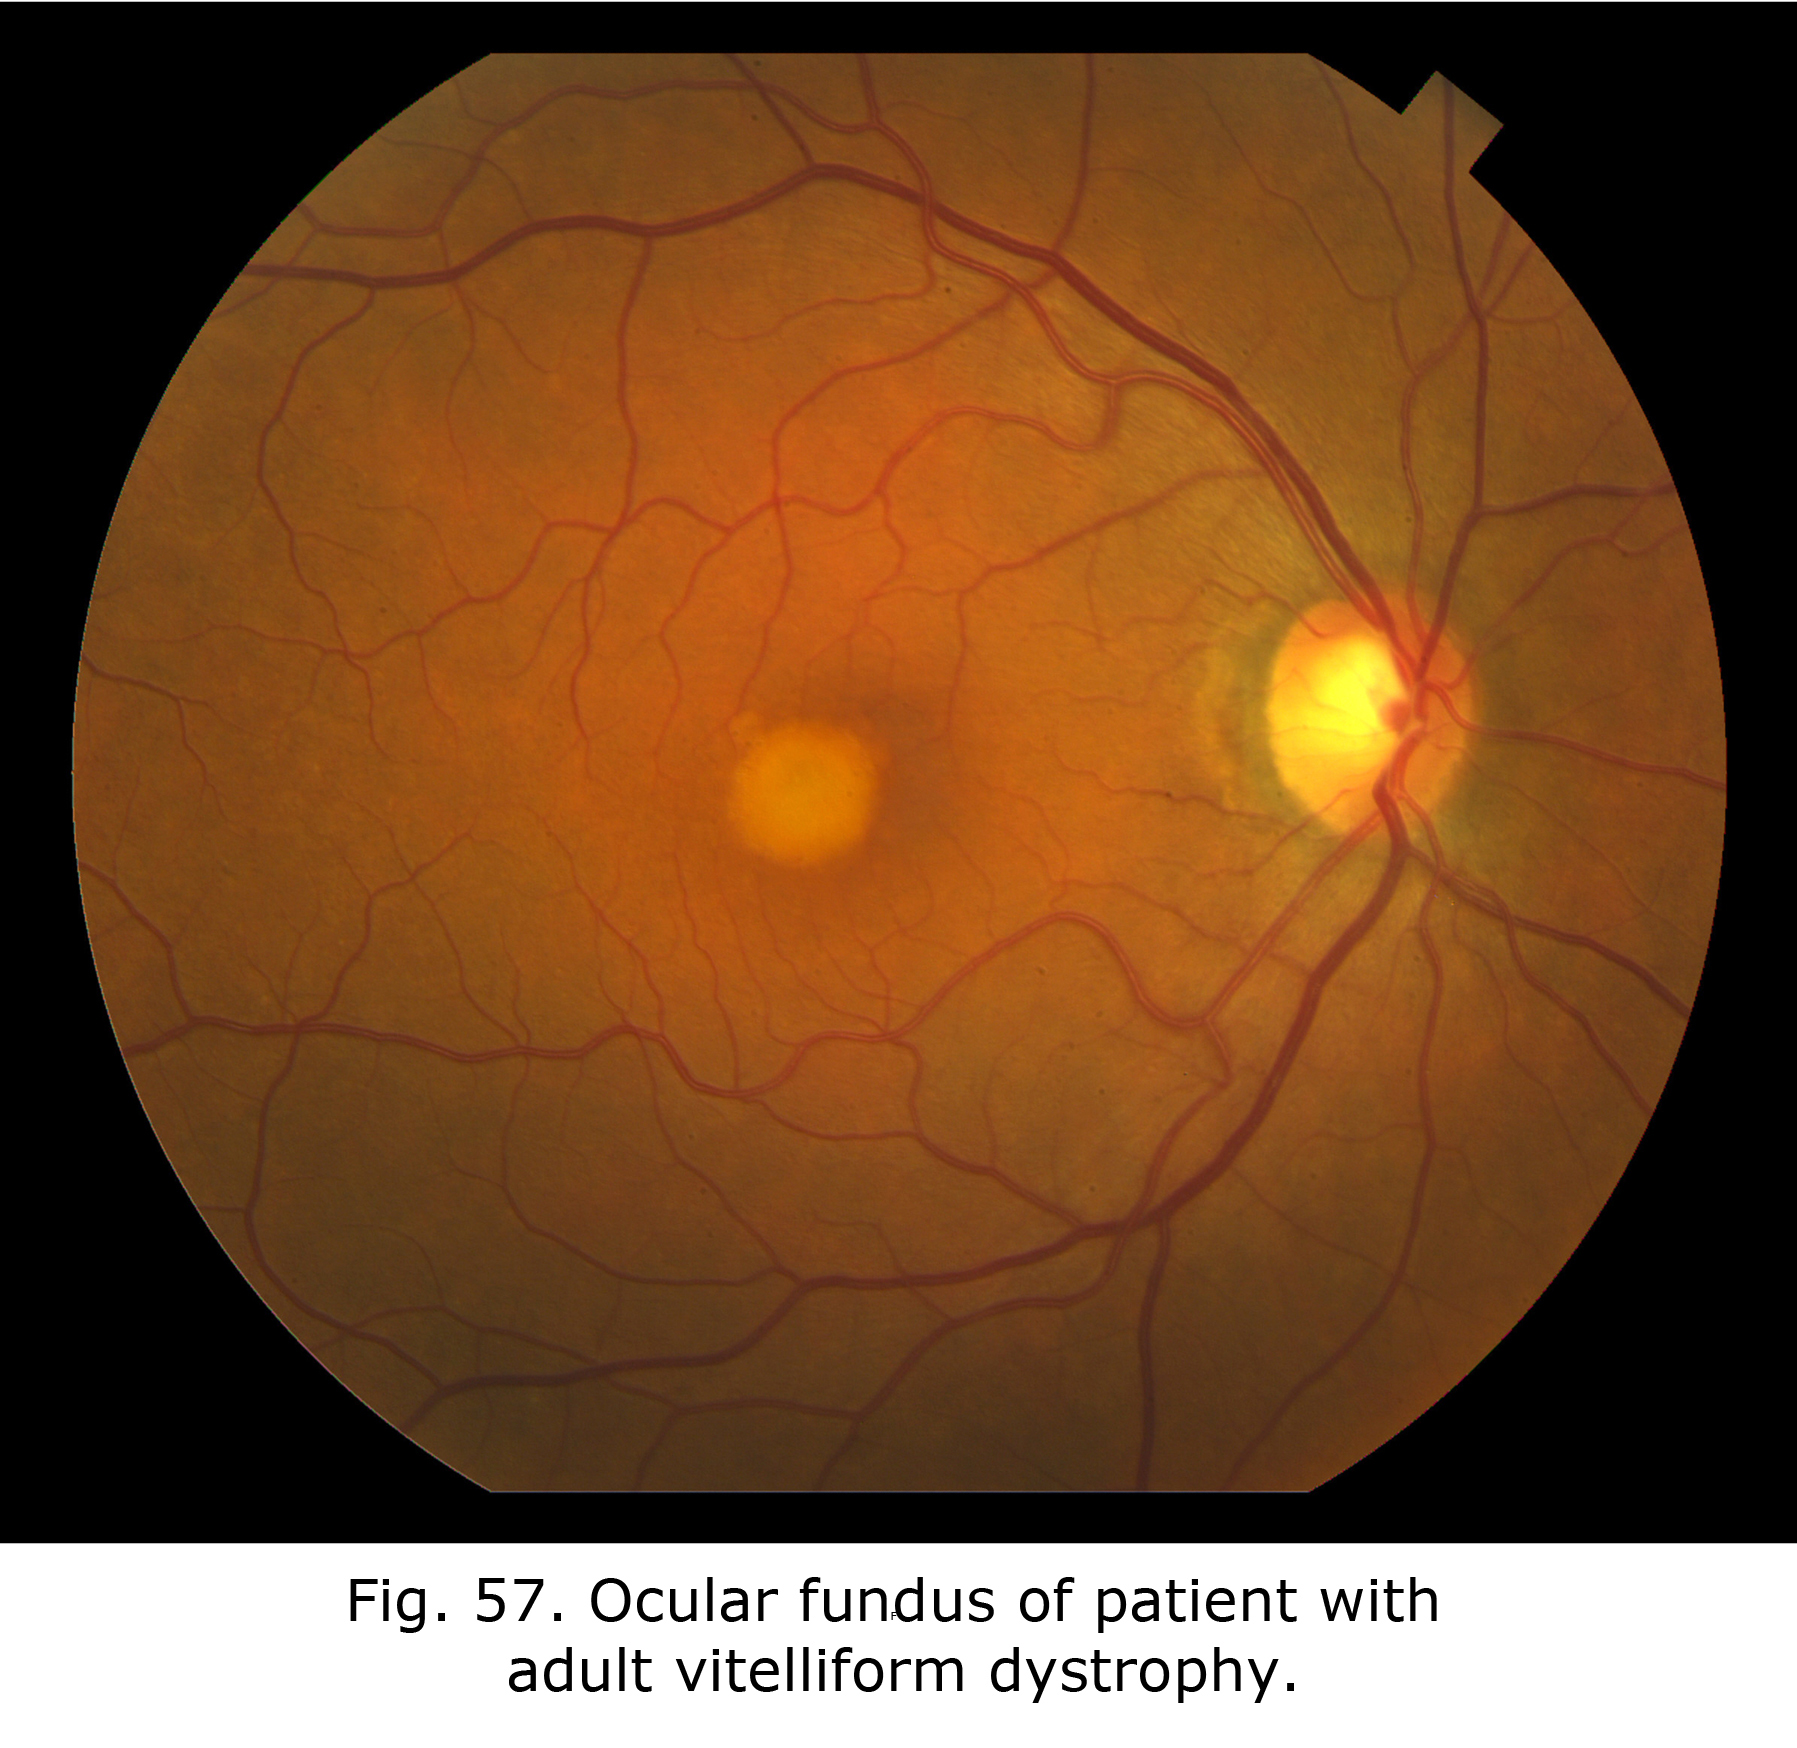 Fig. 57. Fundus in adult vitelliform dystrophy Fig. 57. Fundus in adult vitelliform dystrophy |
Vitelliform lesions represent the accumulation of lipofuscin in the macular area. Further effects of retinal pigment epithelium (RPE) dysfunction include accumulation of degenerated photoreceptor outer segments in the subretinal space. Using autofluorescence imaging (AF) the subretinal accumulation is seen as hyperautofluorescent, suggesting that the material is composed of retinoid fluorophores such as photoreceptor outer segment debris.

Fig. 58 shows the progression of adult vitelliform macular dystrophy (AVMD) in a 50-year-old female. During the initial stage similar to the first OCT dated August 25, 2011, is when the ocular fundus may have a “sunny-side-up” egg yolk appearance. In later stages the lipofuscin disperses resulting in a “scrambled egg” appearance with mottled pigmentation and RPE atrophy. In Best’s disease and in some with AVMD, a dysfunction of bestrophin results in abnormal fluid and ion transport by the retinal pigment epithelium (RPE). Bestrophins are a family of proteins that can function both as Cl(-) channels and as regulators of voltage-gated Ca(2+) channels. It is proposed that dysfunction of bestrophin results in abnormal fluid and ion transport by the RPE and this results in a weakened interface between the retinal pigment epithelium and photoreceptors. Human bestrophin-1 (hBest1), located on human chromosome 11q13, was identified as the VMD2 gene responsible for a dominantly inherited juvenile-onset form called Best’s vitelliform macular dystrophy. Mutations in hBest1 have also been associated with a small fraction of adult-onset vitelliform macular dystrophies (Hartzell et al., 2008). The inheritance pattern of adult-onset vitelliform macular dystrophy is uncertain. The appearance of the ocular fundus and progression of accumulation of lipofuscin within the RPE and sub-RPE space in the foveal area in adult vitelliform macular dystrophy can appear similar to Best disease. AVMD can be differentiated from Best’s disease based on clinical appearance, age of onset, and using OCT, autofluorescence imaging and electro-oculograms.
15. References.
Ala-Laurila P, Cornwall MC, Crouch RK, Kono M. The action of 11-cis-retinol on cone opsins and intact cone photoreceptors. J Biol Chem. 2009;284:16492-16500. [PubMed]
Arden GB, Barrada A, Kelsy JH. New clinical test of retinal function based on the standing potential of the eye. Br J Ophthalmol. 1962;46:449–467.[PubMed]
Arden, GB, Friedman, A. and Kolb. H. (1962) Anticipation of chloroquine retinopathy. The Lancet, June 2, pp 1164-1165.
Boughman JA, Fishman GA. A genetic analysis of retinitis pigmentosa. Br J Ophthalmol. 1983;67:449–454. [PubMed] [Free Full text in PMC]
Creel DJ, Crandall AS, Ziter FA. Identification of minimal expression of myotonic dystrophy using electroretinography. Electroencephalogr Clin Neurophysiol.1985;61:229–235. [PubMed]
Creel DJ, Wang JM, Wong KC. Transient blindness associated with transurethral resection of the prostate. Arch Ophthalmol. 1987;105:1537–1539.[PubMed]
Cobb WA, Morton HB. A new component of the human electroretinogram. J Physiol. 1954;123:36P–37P.
Costedoat-Chalumeau N, Ingster-Moati I, Leroux G, et al. Critical review of the new recommendations on screening for hydroxychloroquine retinopathy [in French]. Rev Med Interne. 2012;33(5):265-267. [PubMed]
Granit R. The components of the retinal action potential in mammals and their relation to the discharge in the optic nerve. J Physiol. 1933;77:207–239.[PubMed]
Hartzell HC, Zhiqiang Q, Kuai Y, Xiao Q, and Chien LT (2008) Molecular physiology of bestrophins: multifunctional membrane proteins linked to Best Disease and other retinopathies. Physiol. Rev. 88: 639-672. [PubMed]
Holmgren F. Metod att objektivera effektenav ljusintryck pa retina. Upsala lakaref Forhandl. 1865;1:177–191.
Hood DC, Bach M, Brigell M, et al; International Society For Clinical Electrophysiology of Vision. ISCEV standard for clinical multifocal electroretinography (mfERG). Doc Ophthalmol. 2012;124(1):1-13. [PubMed]
Katz BJ, Warner JEA, Digre KB, Creel DJ. Selective loss of the electroretinogram b-wave in a patient with Creutzfeldt-Jakob disease. J Neuroophthalmol.2000;20:116–118. [PubMed]
Lawwill T, Burian HM. A modification of the Burian-Allen contact-lens electrode for human electroretinography. Am J Ophthalmol. 1966;61:1506–1509.[PubMed]
Marg E. Development of electro-oculography; standing potential of the eye in registration of eye movement. AMA Arch Ophthalmol. 1951;45:169–185.[PubMed]
Marmor MF, Hock PA. A practical method for c-wave recording in man. Documenta Ophthal Proc Ser. 1982;31:67-72.
Marmor MF, Brigell MG, McCulloch DL, Westall CA, Bach M; International Society for Clinical Electrophysiology of Vision. ISCEV standard for clinical electro-oculography (2010 update). Doc Ophthalmol. 2011 Feb;122(1):1-7. doi:10.1007/s10633-011-9259-0. Epub 2011 Feb 5. PubMed PMID: 21298321. [PubMed]
Marmor MF, Kellner U, Lai TY, Lyons JS, Mieler WF; American Academy of Ophthalmology. Revised recommendations on screening for chloroquine and hydroxychloroquine retinopathy. Ophthalmology. 2011;118(2):415-422. [PubMed]
McBain VA, Egan CA, Pieris SJ, Supramaniam G, Webster AR, Bird AC, Holder GE. Functional observations in vitamin A deficiency: diagnosis and time course of recovery. Eye (Lond). 2007;21:367-376. [PubMed]
McCulloch DL, Marmor MF, Brigell MG, Hamilton R, Holder GE, Tzekov R, Bach M. ISCEV Standard for full-field clinical electroretinography (2015 update). Doc Ophthalmol. 2015;130:1-12. doi: 10.1007/s10633-014-9473-7. Epub 2014 Dec 14. PubMed PMID: 25502644. [PubMed]
Michaelides M, Stover NB, Francis PJ, Weleber RG. Retinal toxicity associated with hydroxychloroquine and chloroquine: risk factors, screening, and progression despite cessation of therapy. Arch Ophthalmol. 2011;129(1):30-39. [PubMed]
Miller RF, Dowling JE. Intracellular responses of the Muller (glial) cells of mudpuppy retina: their relation to the b-wave of the electroretinogram. J Neurophysiol. 1970;33:323–341. [PubMed]
Pasek TA, Huber JM. Hospitalized infants who hurt: a sweet solution with oral sucrose. Crit Care Nurse. 2012;32:61-9. [PubMed]
Perlman I. Relationship between the amplitudes of the b wave and the a wave as a useful index for evaluating the electroretinogram. Br J Ophthalmol.1983;67:443–448. [PubMed] [Free Full text in PMC]
Rushton WA, Henry GH. Bleaching and regeneration of cone pigments in man. Vision Res. 1968;8(6):617-631. PubMed PMID: 5729910. [PubMed]
Sutter E E Noninvasive Testing Methods: Multifocal Electrophysiology. In: Darlene A. Dartt, editor. Encyclopedia of the Eye, Vol 3. Oxford: Academic Press; 2010. pp. 142-160.
Tang PH, Kono M, Koutalos Y, Ablonczy Z, Crouch RK. New insights into retinoid metabolism and cycling within the retina. Progress in retinal and eye research. 2013;32:48-63. [PubMed]
Vitale AT. Birdshot chorioretinopathy. In: Foster CS, Vitale AT, editors. Diagnosis and Treatment of Uveitis, 2nd Ed., New Delhi: Jaypee Brothers Medical Publishers Ltd, 2013. p. 982-1005.
Wachtmeister L, Dowling JE. The oscillatory potentials of the mudpuppy retina. Invest Ophthalmol Vis Sci. 1978;17:1176–1188. [PubMed]
Weleber RG. The effect of age on human cone and rod ganzfeld electroretinograms. Invest Ophthalmol Vis Sci. 1981;20:392–399. [PubMed]
Acknowledgements: I thank John A. Moran Eye Center Imaging for the photographs in this chapter, especially James Gilman for contributing images from his library.
Updated July 14th, 2015
The author

Dr. Donnell J. Creel was born in Kansas City, Missouri. He received his B.A and M.A. from the University of Missouri at Kansas City, and his Ph.D. from the University of Utah in 1969. In 1971 Don first made the connection that visual anomalies in Siamese cats was associated with albinism and hypothesized that all albino mammals likely have optic misrouting, and published first visual evoked potential studies in human albinos in 1974 and ocular albinos in 1978. Don has been the Director of Clinical Electrophysiology at the Moran Eye Center since its inception in 1993. e-mail Don at donnell.creel@hsc.utah.edu