Peter Gouras
1. Introduction.
Color vision is an illusion created by the interactions of billions of neurons in our brain. There is no color in the external world; it is created by neural programs and projected onto the outer world we see. It is intimately linked to the perception of form where color facilitates detecting borders of objects (Figure 1).

Fig. 1. A floral scene with and without color
Color is created by utilizing two properties of light, energy and frequency of vibration or wavelength. How our brain separates these two properties of light, energy and wavelength, and then recombines them into color perception is a mystery that has intrigued scientists through the ages. We know much about the nature of light and the subjective impressions of color, definable by physical standards (Wright, 1946) but ultimately color should be explained at the level of single cells in our brain. Examination of the responses of single neurons or arrays of such neurons provides the best insights into the physiology of color vision. Ultimately our understanding of this process will allow us to model the neural circuits that underlie the perception of color and form. Although still beyond reach, progress is being made in deciphering these clever circuits that create our perception of the external world.
We start by describing the nature of the photoreceptors that convert light energy into neural signals. Then we consider the parallel channels leading from the retina to the thalamus carrying information into visual cortex, where color is ultimately determined. Lastly we use our current understanding to speculate on how visual cortex uses neural circuits to create the perception of color and form.
2. The Photoreceptors.
Photoreceptors are neurons specialized to detect light. The detection occurs in an organelle called the outer segment, a membranous structure where light absorbing proteins, opsins, are embedded. There are two major types of photoreceptors in most vertebrate eyes, rods and cones. Rods are very sensitive but slow and their response saturates at light levels where cones function optimally. Rods are are not used much in modern society where artificial illumination adequate for cone vision is ubiquitous. Cones are less sensitive but are fast and can adapt to the brightest lights, being almost impossible to saturate. Cones evolved before rods undoubtedly in areas of strong sunlight where vision was a great advantage. In broad sunlight, shadows are strong and more important to detect than increments of light in the struggle for survival. Shadows depolarize cones leading to a release of a transmitter that influences second order retinal neurons. The appearance of light hyperpolarizes cones leading to a curtailing of this transmitter.
A cone responds only to the energy it absorbs (Maxwell 1872). All wavelength of light can produce identical responses from a cone if the energy absorbed by the cone is the same for these wavelengths (Figure 2). Cones are therefore color blind producing a univariant response reflecting only the amount of energy they absorb. Detecting objects by the energy reflected from their surfaces, however, can fail when objects reflect a similar amount of energy as their background. Here is where color vision becomes important. Wavelength contrast can detect objects when energy contrast is absent or minimal. An object can reflect the same energy but seldom reflects the same wavelength composition as its background. Color vision combines both energy and wavelength contrasts to detect objects and this advantage must have evolved early in the evolution of vision.

Fig. 2. shows different wavelengths (colors) producing identical responses from cones
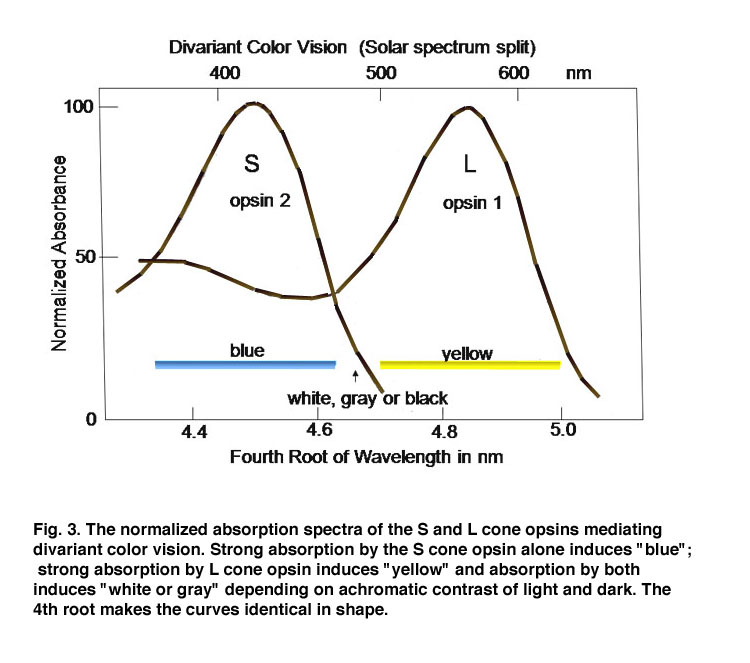
In order to detect objects by differences in spectral reflectance, two or more different types of cones are needed. This is an important concept for understanding color vision. For divariant color vision, two cone types must exist and be sensitive to different parts of the visible spectrum, preferably as different as possible. The range of the visible spectrum depends on the ability of light to penetrate the eye and be absorbed by the photoreceptors. Ultra-violet light is absorbed by the anterior segment of our eyes and seldom reaches the photoreceptors. Infra-red light penetrates our eye readily but its quantal energy may be too small to activate opsins. Therefore early in the evolution of color vision, opsins sensitive to the middle of our visible spectrum evolved, near spectral yellow, and a short wavelength opsin evolved in a second type of cone, near spectral blue (Figure 3). These have been called L (long wavelength sensitive) and S (short wavelength sensitive) cones, respectively, and this was a first step in the evolution of color vision.
In animals with large eyes, an interesting strategy evolved. L-cones were used to detect both energy and wavelength contrast but S-cones were used only for wavelength contrast. This was due to chromatic aberration. Short wavelength images are out of focus when longer wavelength images are in focus on the photoreceptor mosaic. Chromatic aberration increases greatly at short wavelengths, which led to the L cone system dominating energy contrast. As a result there are many more L than S cones in many mammals in order to gain spatial resolution by achromatic contrast detectable by L cones.
In animals with small eyes, like mice and rats, ultra-violet light can reach the photoreceptor mosaic and in this case ultra-violet sensitive cone opsins have evolved to widen the spectral range of vision and if combined with L cones could allow color vision (Haverkamp et al., 2005; Ekesten and Gouras, 2005; Yin et al., 2008). Chromatic aberration is reduced in these small, highly spherical eyes which have outer segments as long as animals with large eyes. This increases their depth of focus minimizing chromatic aberration, an advantage of being small. Their retinal images are less magnified, however, than those in large eyes.
3. Chromatic and Achromatic Contrast
In order to establish chromatic contrast it is necessary to compare the responses of a group of cones of one type with the responses of a group of cones of another type within the same area of visual space. One cannot compare only two neighboring cones such as the S and the L cone in Figure 4A.
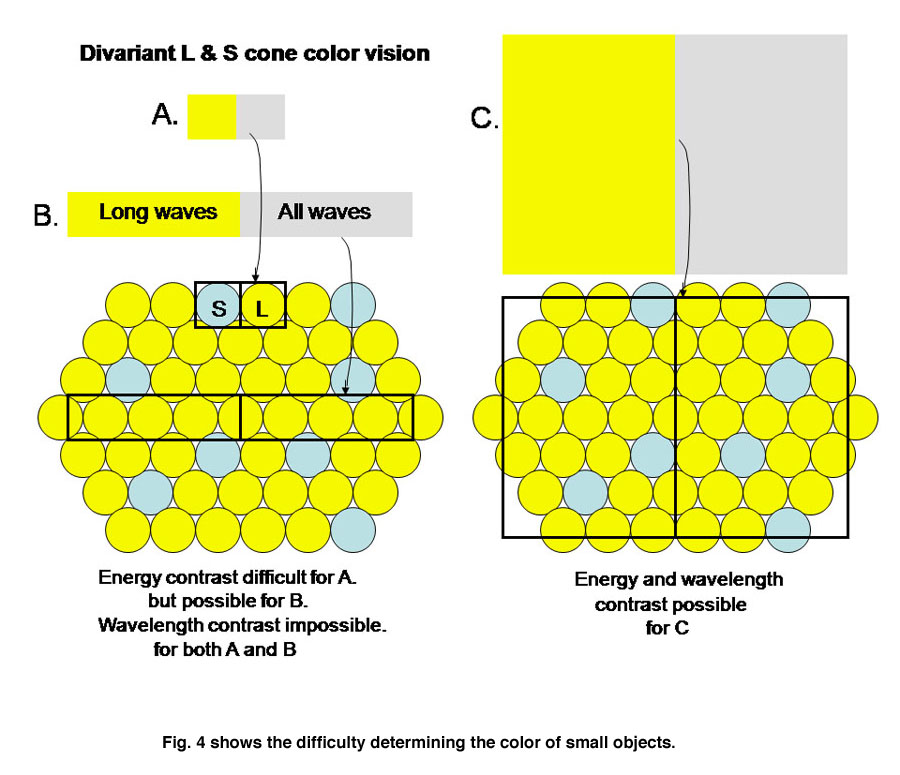
Fig. 4 shows the difficulty determining the color of small objects
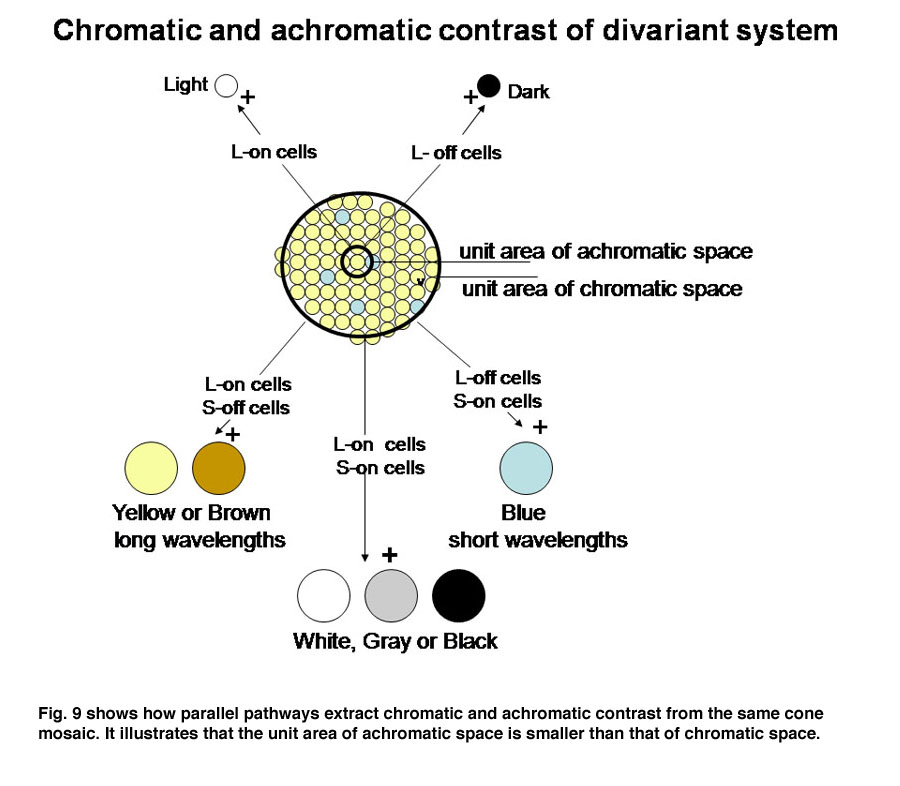
If an image of gray and yellow were to cover these two cones in an inappropriate way as done in Figure 4A the brain would reach an erroneous conclusion about this border because the S cone would not be affected by the yellow side and the L cone would be strongly affected by the gray side. The brain might consider this to be a black/yellow border rather than a yellow/gray border. Even if a slit of light imaged on only the more numerous L cones (Figure 4B), there would be ambiguity about the colors of adjacent images. If only L cones are affected by both yellow and gray light, the brain would not see any border here. Only when a larger image which covers a number of S and L cones (Figure 4C) can an unequivocal decision be made about the color of these bordering images. In this case the left side, which is yellow, would strongly affect L but not S cones and therefore be judged to be yellow. The right side of this border, which is gray, would strongly affect both L and S cones and therefore would appear white or gray. For achromatic contrast, smaller images can be analyzed for border contrasts and in most cases only two neighboring cones would be sufficient to distinguish a light/dark border. This is why a unit area of achromatic space is smaller than a unit area of chromatic space.
4. Horizontal Cells.
Cones receive an antagonistic input from horizontal cells, whose cell bodies reside in the outer nuclear layer and whose processes contact the spherules of rods and the pedicles of cones (Kolb, 1991). There are at least two varieties of cone horizontal cells (Figure 5).
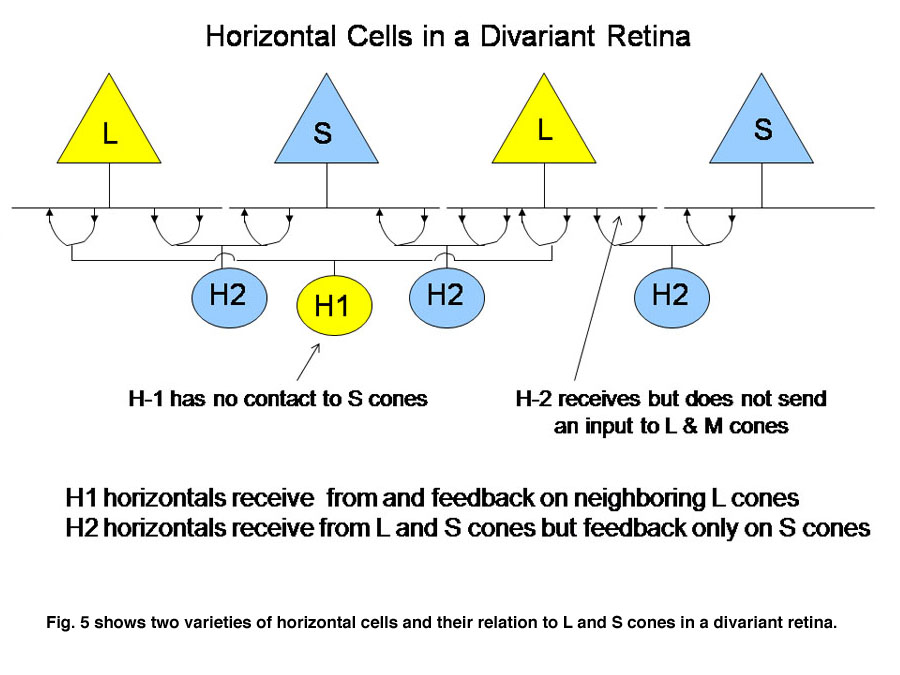
One variety (H1) only contacts L cones; the other variety contacts both S and L cones (H2). Cone horizontal cells receive an excitatory input from cones and send back an inhibitory input to cones. This is a type of negative feedback. When a cone is hyperpolarized by an increment or depolarized by a decrement of light, it receives an opposing input from horizontal cells after a brief synaptic delay. This dampens the response and can also reduce the effects of scattered light by minimizing cone responses outside of the focal image on the retina. In color vision the horizontal feedback also acts to narrow the action spectrum of cone bipolar cells. In divariant color vision this can narrow the action spectrum of S cone bipolar cells. This occurs because the processes of the H2 horizontal cell that reach L cones are only post-synaptic to S cones. Therefore L cones can send an antagonistic signal to S cones which can reduce the effectiveness of wavelengths, absorbed by both L and S cones and this narrows the action spectrum of the S cone channels (Packer et al., 2007).
5. Bipolar and Ganglion Cells.
The retina is composed of three layers of neurons, the outermost being the photoreceptors, rods and cones, which for divariant color vision are L and S cones. A second layer of bipolar cells transmits the signals of the photoreceptors to a third layer of neurons, the ganglion cells whose axons form the optic nerve. The ganglion cells serving the two photoreceptor systems are quite different. The L cones synapse with unique bipolar cells, called “midget” bipolar. These single cone detectors were discovered by Stephan Polyak in monkey retina using the Golgi method of silver impregnation. Because of their small size they were called “midget” bipolar cells. This provides the brain with the ultimate in spatial resolution, a single cone, and in addition isolates the signals of L cones which can be used for color vision. A feature of this L cone bipolar system is the presence of two types of cells (Figure 6). One type of L cone bipolars depolarizes whenever the cone or cones they synapse with hyperpolarize; this set is called on-bipolars because they are excited (turned on) by light. The other set is depolarized whenever the cones they synapse with detect decrements of light; this set is called off-bipolars because they are excited by darkness and inhibited (turned off) by light. These two sets of cone bipolar cells synapse with separate sets of on and off ganglion cells at two levels in the inner plexiform layer of the retina, a more external off-lamina and a more internal on-lamina (Nelson et al., 1978).
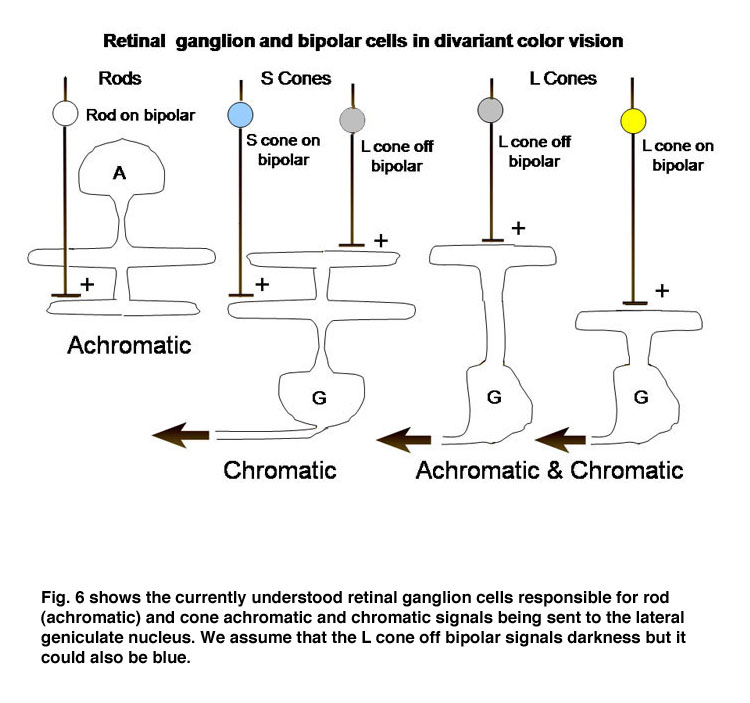
These parallel channels, transmitting lightness and darkness from local retinal areas, are maintained throughout the visual pathway to visual cortex. This “push-pull” system of neurons is thought to increase the dynamic range for detecting decrements and increments of light in local areas of the retinal image. Only L cones seem to be connected to both on and off bipolar cells while S cones are connected to only on-bipolar cells. The reason for this may be that the latter are only involved in chromatic vision while the former are involved in both chromatic and achromatic vision. Achromatic vision involves the detection of lightness and darkness while chromatic vision involves the detection of color. Not only do S cones lack an off-bipolar system but they have a much different route to the ganglion cell output layer. The S cone on bipolar excite the internal arbor of a bistratified ganglion cell while a wide-field L cone off bipolar excites the external arbor of this same ganglion cell (Dacey & Lee, 1994). This S cone system is absent in the very center of the fovea where achromatic contrast is mediated by the L cone midget system. Away from the fovea the L cone midget system begins to contact more than one cone and therefore loses spatial resolution.
There is a second ganglion cell system that plays no role in color vision but is also connected to only L cones. These are parasol ganglion cells. They are larger cells with faster conduction velocities and they target the magno-cellular layers of the lateral geniculate nucleus (LGN). They appear to play a role in the detection of movement and possibly slow tracking movements. There is some evidence that they might receive an input from S cones but I have never been able to detect such an input. Barry Lee’s group considers these cells play a role in the detection of luminance (Lee, 2008).
6. Divariant Blue/Yellow Color Vision
The ganglion cells in Figure 6 are thought by most to be the essential channels for divariant color vision. The bistratifid S cone on-cells and the L cone midget cells monitor the light absorption of S and L cones respectively. The signals from these two channels must be compared in the same areas of visual space for color vision. The cone bipolar cells driving the bistratified S cone on-ganglion cells have co-extensive fields (Figure 7), which is ideal for comparing differences between two cone mechanisms in the same area of visual space.
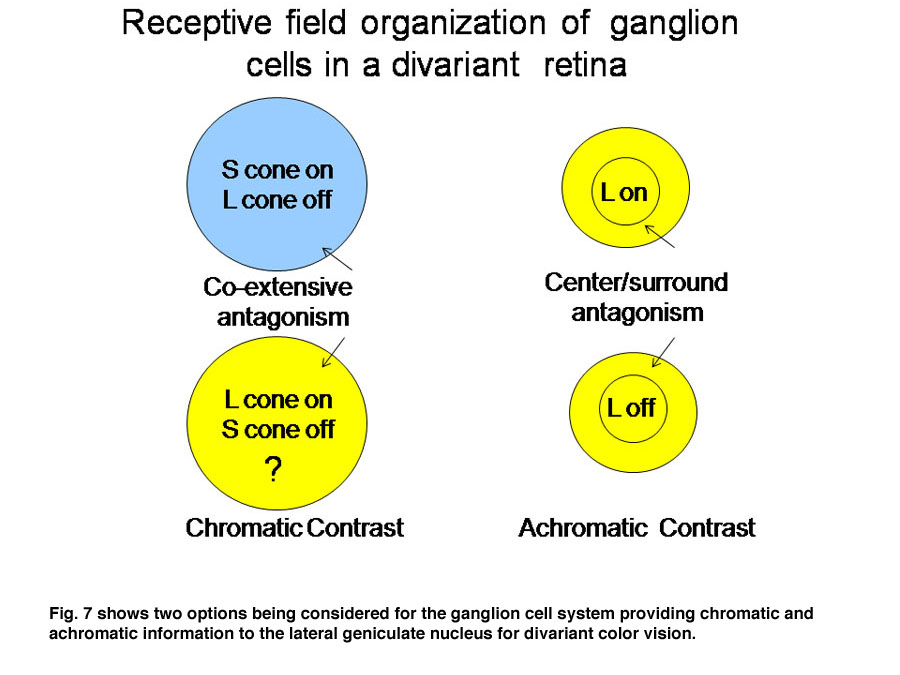
These two different bipolar inputs to the bistratified ganglion cell do not appear to oppose each other because these cells are excited by white light. Another more indirect input to these cells comes from the H2 horizontal cell which transmits antagonistic signals from L to S cones. This input provides spectral antagonism to the bistratified ganglion cell because light activation of L cones will produce a depolarizing signal in S cones that counteracts the hyperpolarization produced by short wavelength light. The strong response to white light, however, implies that this H2 mediated antagonism is relatively weak.
The channel transmitting L cone signals for spectral contrast in visual cortex has been considered to be the midget system, at least in primates. These midget ganglion cells are considered to receive no input from S cones, either synergistic or antagonistic, although there are connections to S cones through H2 horizontal cells. In trivariant monkey retina there is no evidence of S cone input to either the midget or the parasol ganglion cell systems which implies that H2 horizontal cells are only post- and not pre- synaptic to L cones. The H1 horizontal cell only contacts L cones and therefore provides only spatial antagonism to neighboring L cones and does not produce spectral antagonism.
This previous picture is not accepted by everyone. There is evidence that a L cone on/S cone off ganglion cell exists to provide an opponent L cone on input to visual cortex (Tailby, 2008: Neitz and Neitz, 2008; Martin et al., 1997; Chatterjee and Callaway, 2003). It has been difficult to find such a ganglion cell in primate retina but they they have been reported in the koniocellular layers of the primate lateral geniculate nucleus. These geniculate cells have been traced back to their retinal ganglion cell inputs, which have their dendritic arbors in the on-lamina of the inner plexiform layer, quite different than the bistratified arbors of S on/ L off ganglion cells. This produces a curious difference in the blue/yellow channels of color vision in primates. In small animals, ground squirrels, guinea pigs and mice, there appears to be a more symmetrical system of S cone on/Lcone off and M cone on/S cone off opponent ganglion cells, both of which send their dendrites to the on-lamina of the inner plexiform layer. This implies that the horizontal cells and/or intervening amacrine cells are involved in their unique opponent organization, perhaps more similar to the rod system. The existence of this retinal L cone on/S cone off channel would preclude the midget cells depicted in Figure 7 from contributing to color vision in animals with divariant color vision..
A more iconoclastic hypothesis recently proposed by the Neitz group considers the bistratified S cone on/L cone off retinal ganglion cell to play no role in color vision proposing that its signals go to the brain stem where they mediate unconscious visual functions together with light sensitive retinal melanopsin ganglion cells. They propose that surround antagonism from the H2 horizontal cell turns L cone off-center midget bipolar cells into S cone-on/L cone-off cells and L cone-on/S cone-off cells. This hypothesis brings S cone signals into the midget ganglion cell system designed for high spatial resolution. Evidence that the bistratified S cone on-cell does affect conscious vision comes from an observation of W.S. Stiles (1949) that his S cone mechanism, isolated psychophysically, affects conscious experience because it exhibits a curious behavior; its sensitivity declines when a long wavelength adapting light, which has no effect on S cones, is turned off. The bistratified S-cone ganglion cell exhibits this same behavior implying that its signals do reach visual cortex and consciousness. It is also possible, however, that the unusual midget cells proposed by the Neitz team also exhibit this phenomenon, which has been labeled “transient tritanopia”.
Regardless of which of these three hypotheses is correct, there must be a way for the visual cortex to compare L with S cone activity in the same area of visual space in order to produce color vision. In Figure 8 we use two of the ideas that are demonstrated in Figure 7 to illustrate how striate cortex uses these retino-geniculate inputs to construct cells that are more responsive to color.
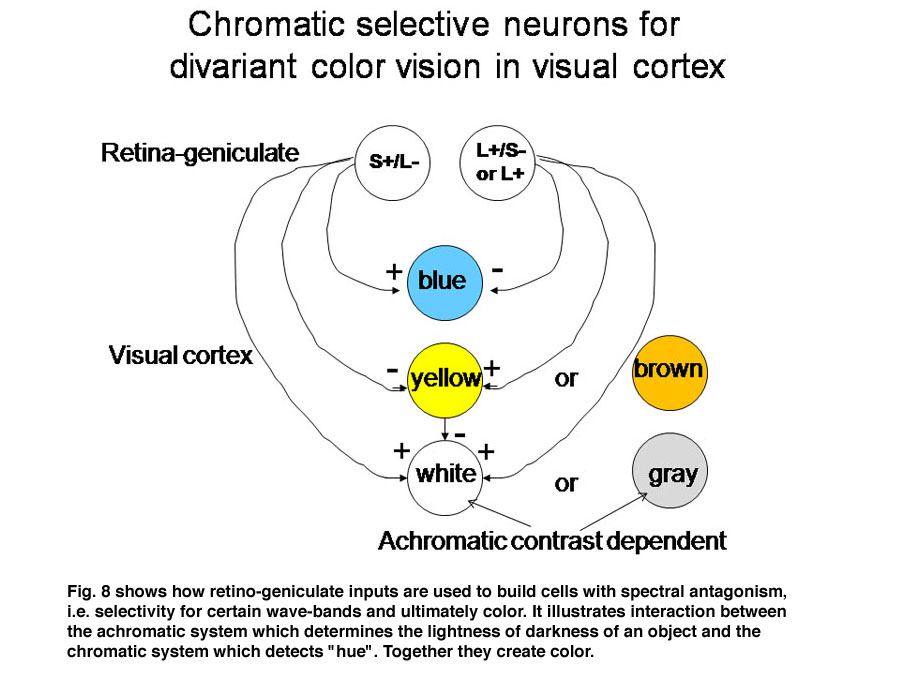
Figure 9 shows a logical way to extract the signals from the cone mosaic into parallel channels mediating achromatic contrast with high spatial resolution and chromatic contrast with lower spatial resolution from the same mosaic.
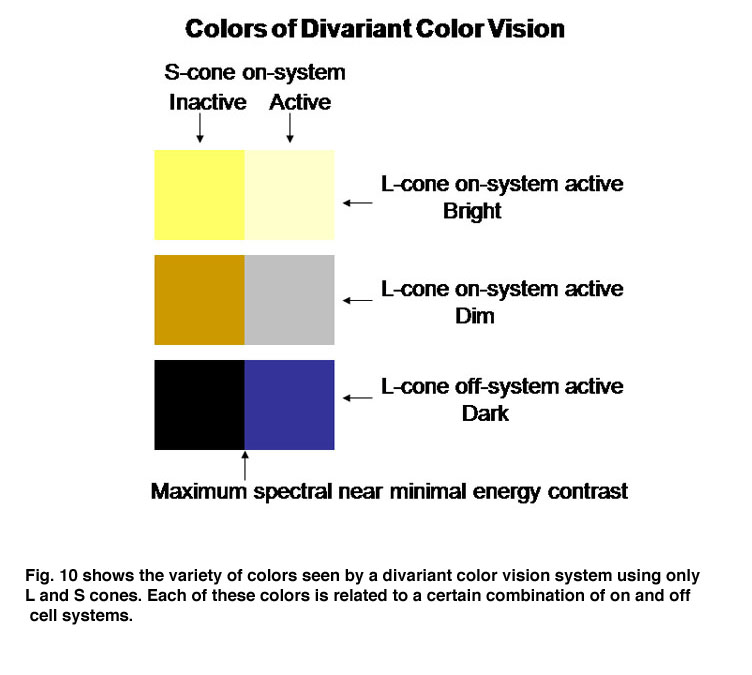
The perception of color mixes both achromatic with chromatic signals to create the combined experience of color. In this arrangement the S cone system only plays a role in chromatic vision while the L cone system contributes to both chromatic and achromatic vision. The repertoire of colors that are produced and their relationship to the activity of the two cone mechanisms involved are shown in Figure 10; these colors are shown at borders of minimum achromatic contrast where chromatic contrast becomes most important.
7. Color Constancy and Double Opponency
The schemes of the previous figures neglect a problem called “color constancy”. We see colors as unchanged even when there are large changes in the spectral properties of an illuminant. The colors in a scene illuminated by fluorescent lights, which generate much short wavelength energy or by tungsten filament lights, which generate much long wavelength energy are not significantly altered by such changes. In other words we should see things “bluer” in fluorescent light and redder in tungsten light but we don’t. This constancy of colors despite changes in illumination intrigued Edwin Land, the founder of the Polaroid Corporation, who spent years investigating this phenomenon and demonstrating significant global aspects of color vision. Local objects can reflect identical spectral components from their surfaces but will appear of different color because of the influence of the entire scene. He proposed a model in which the signals from each cone mechanism are normalized over the entire visual scene before being compared with each other locally to generate the perception of the color of an object scene. Figure 11 illustrates why this idea is reasonable. Here two lights beams, one white, the other yellow illuminate a screen.
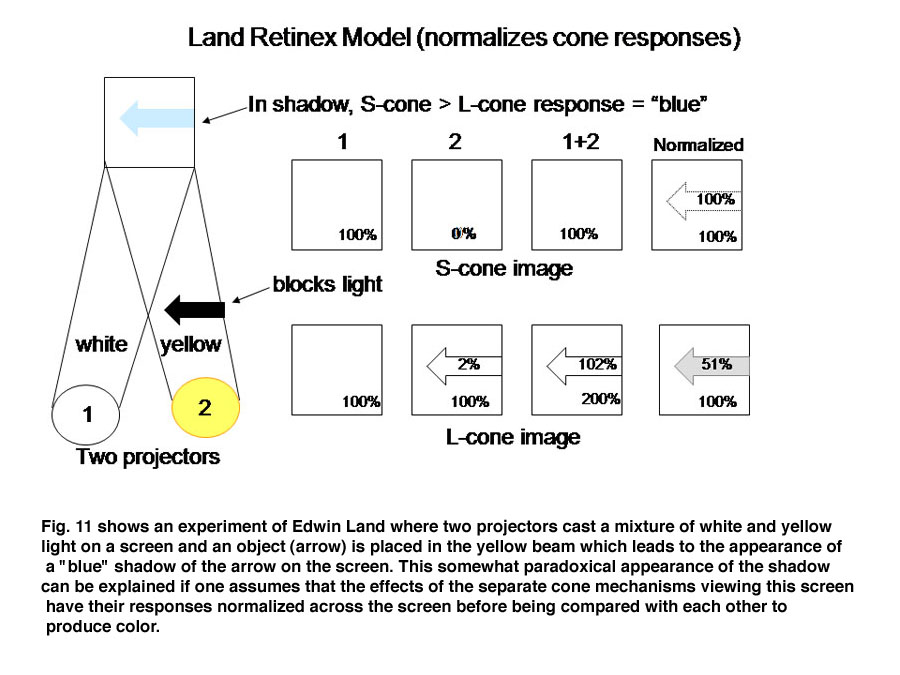
An arrow blocks a portion of the yellow beam and this produces a shadow that appears “blue”. If one determines the light energy being absorbed by the L and S cones from the screen, it is apparent that there is more light affecting the L than the S cones coming from the shadow, which would suggest that the shadow should look yellow and not blue. But if one normalizes the light coming from the entire screen to 100%, then the relative effect on the S cones becomes greater than that on the L cones and the shadow appears “blue”. This supports the idea that responses from each cone mechanism across the entire visual scene are first normalized before being compared with each other locally to produce the perception of color from specific objects in the scene. Such normalization could occur if S cone and L cone transmitting neurons were to inhibit each other following the rules outlined in Figure 12. This could reduce the responses to global illumination that affected one cone mechanism more strongly than the other and support color constancy. If, in addition, the excitation of these cone specific channels were organized so that each local area of color space would be enhanced by neighboring spectral contrast between cone mechanisms it would lead to simultaneous color contrast.
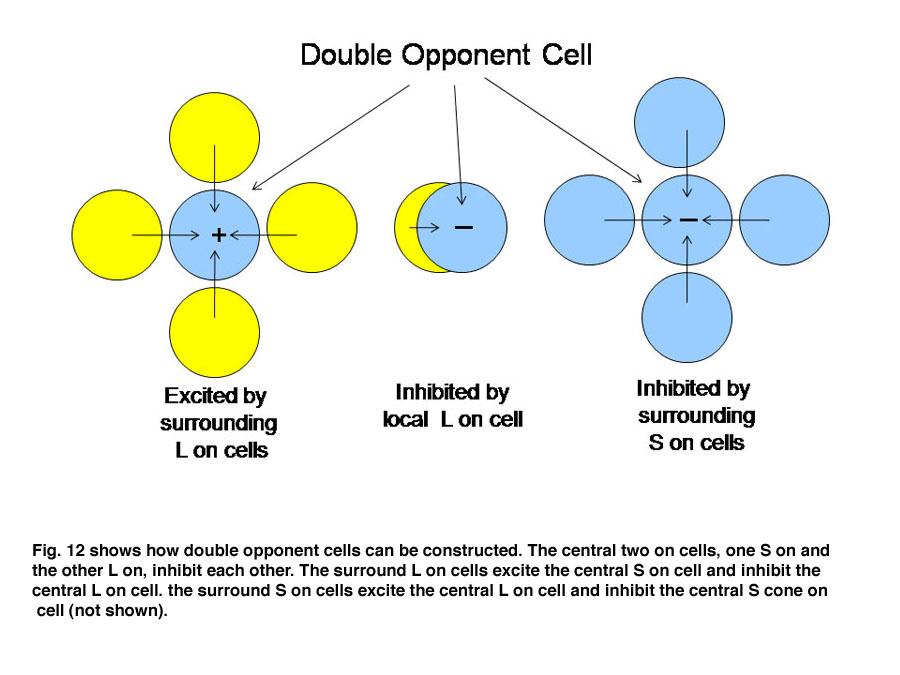
By the rules of Figure 12, a unit area of color space A would appear “blue” if there were short wavelengths and no long wavelengths in area A; the converse would lead to “yellow”. This blueness or yellowness would be enhanced if the surrounding areas of color space were activated by the opposite color, i.e. simultaneous color contrast. Such cells have been called “double opponent” cells because they have one form of antagonism between cone mechanisms mediating a local area of color space and an opposite arrangement in neighboring areas of color space. Charles Michaels found such cells in striate cortex of non-human primates following up on observations of Nigel Daw in goldfish retina. Double opponency tends to separate spectral from energy contrast.
8. Trivariant Color Vision
In primates, high resolution vision and trivariant color vision evolved to enhance survival. A fovea formed to facilitate high resolution achromatic vision and a third opsin evolved from the original mammalian L cone opsin to create a new dimension of color in higher primates (Jacobs, 2008). The gene for the L cone opsin duplicated itself and one of the paired genes developed polymorphisms to absorb further into the long wavelength region of the spectrum. The original long wave sensitive L cone now became an M cone being the partner of an even longer wavelength sensitive L cone. Figure 13 shows that a trivariant system can detect a larger variety of spectral reflectances (Mollon, 1989). In Figure 13 above right, one sees that a divariant color vision system can detect spectral contrasts that reflect more at one end than at the other end of the spectrum; these reflectances tend to tilt the solar spectrum.
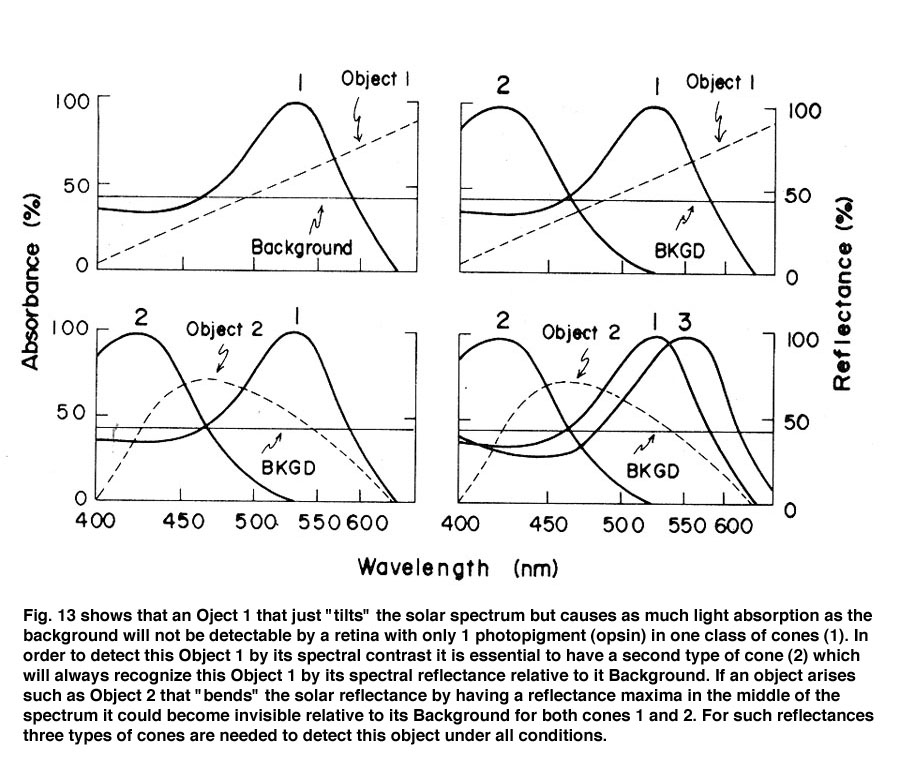
If, however, a surface reflects less from both sides of the visible spectrum, i.e. bending the solar spectrum, it might be invisible to a divariant system because both cone types could be absorbing the same amount of light from the object and its background (Figure 13 lower left). A trivariant system detects this object because it is impossible for all three cones to be absorbing the same amount of light from the object and its background (Figure 13 lower right). More complex reflecting surfaces might confuse even a trivariant system but they are probably very rare in the natural world. This change split the yellow region of the original spectrum and created two new chromatic percepts, red and green (Figure 14). It is noteworthy that a rise in the beta-band absorption of this new L cone pigment also provided a long wave influence at the short wavelength region of the spectrum.
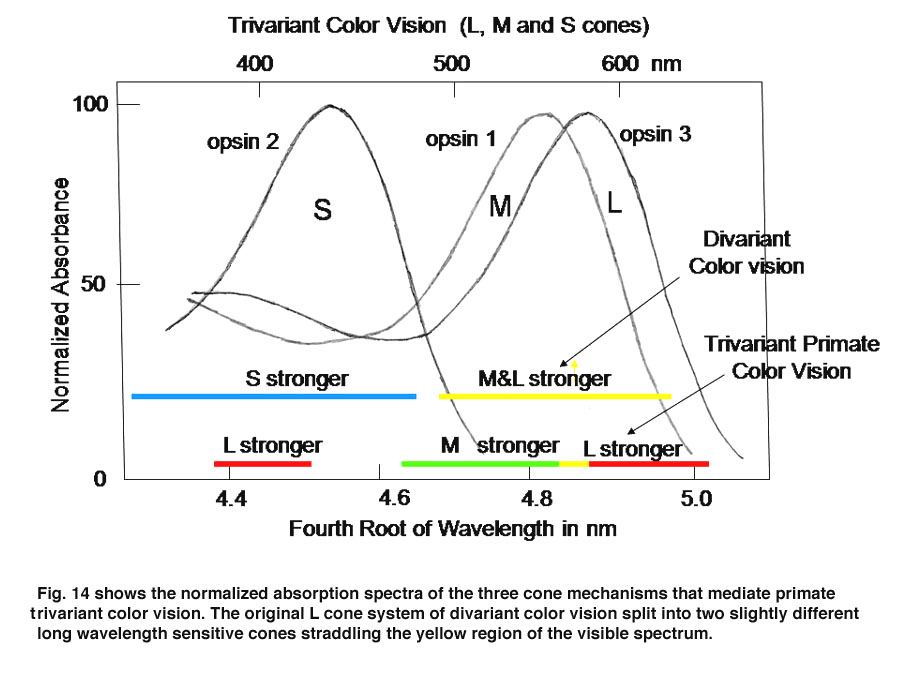
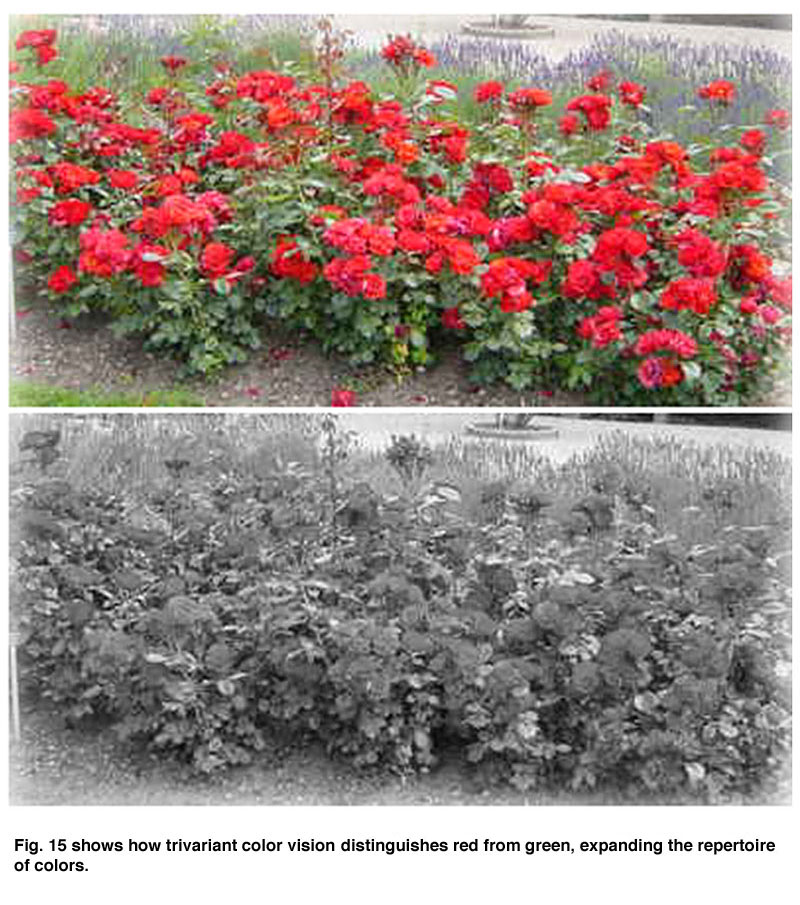
Figure 15 shows how a trivariant system facilitates the distinguishing of red and green objects which would remain indistinguishable for a divariant observer.
In the fovea, the same midget cells which had been contacting only single L cones for divariant color vision now contacted either an L or an M cone (Figure 16), providing the brain with separate channels for these two different cones and another opportunity for chromatic contrast.
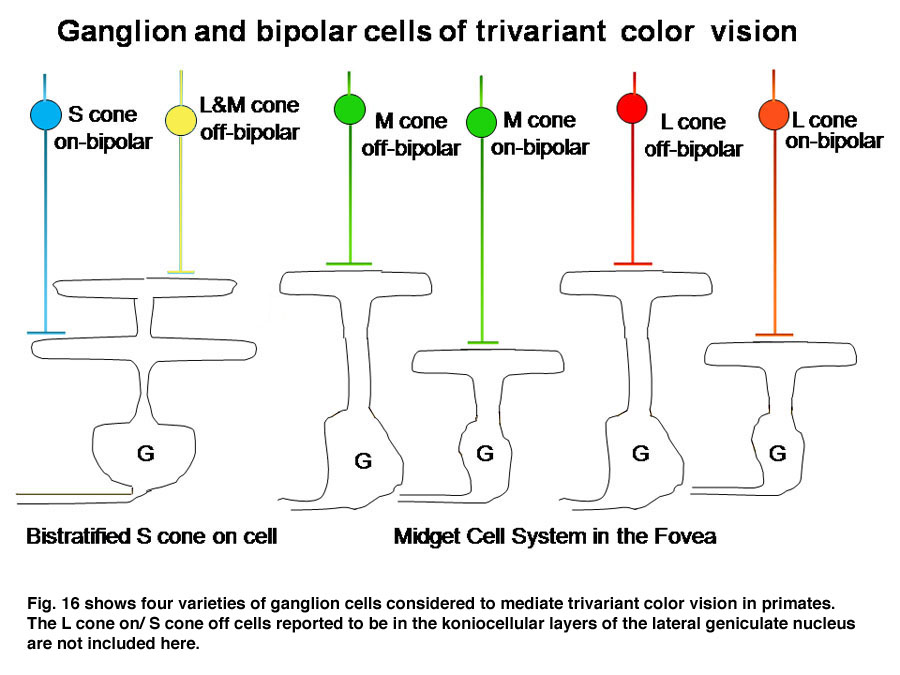
In Figure 16 it is assumed that the bistratified S cone on cell conveys S cone signals from the retina and the midget cell system conveys the signals of L or M cones for color vision (Kolb, 1991). The midget cell system is currently assumed to play a role as a “double duty” detector contributing to both high spatial resolution achromatic vision and lower spatial resolution chromatic vision.
Figure 17 (upper) shows the responses of a midget ganglion cell receiving an excitatory L cone input. This cell is continuously excited by the red adapting field; under these conditions the cell does not respond to the small red spot. A blue adapting field stops this continuous discharge and under these circumstances the cell responds to the small red spot. Figure 17 (lower) shows the responses of an L cone on midget ganglion cell (large amplitude) and a M cone on midget-like ganglion cell (small amplitude) responding to a small red spot in the presence of the same adapting fields. The red adapting field continuously excites the L cone cell and inhibits the M cone cell; under these conditions the small red spot inhibits the L cone cell, an inhibition mediated by M cones.
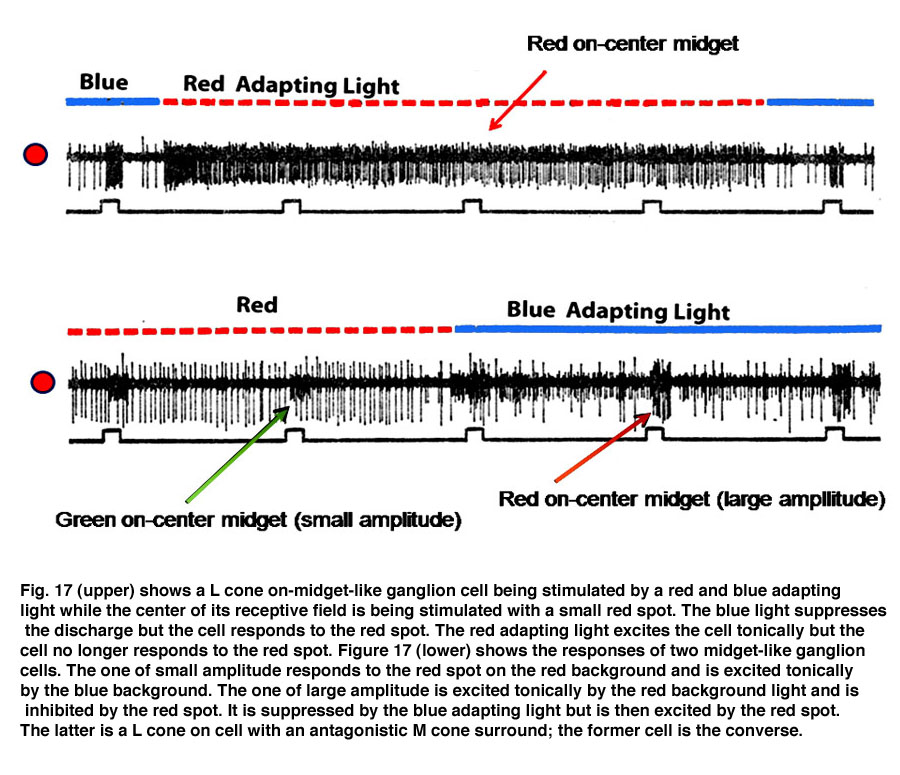
Figure 18 shows an S cone on-cell responding to spectrally narrow stimuli.

The cell is excited by the blue spot on the yellow background and is profoundly excited by the turning off of the yellow adapting light. The cell is not responsive to the red spot in the presence of the yellow adapting light but is inhibited by the red spot in the absence of the adapting light.
Figure 19 illustrates how these midget cells could participate in both chromatic and achromatic vision. The same concentrically organized retinal and geniculate cells feed two different circuits in striate cortex. One achromatic with a large number of orientation selective neurons capable of high spatial resolution and the other chromatic built up from the same center/surround organized midget-like cells. How center/surround cells can build up a circuit which is more co-extensively organized more suitable for chromatic processing remains enigmatic.

David Hubel (1987) and the late Bob Rodieck (1988) have suggested that the midget system may not be involved in mediating chromatic vision but another much less common ganglion cell type with a receptive field in which L and M cones driving these cells are co-extensively rather than concentrically organized in the receptive field of these cells. It has been difficult to obtain any evidence for such a cell.
The evolution of trivariant color vision in higher primates increased the repertoire of colors we perceive and the power of spectral contrast to detect objects. The original blue/yellow form of color vision was now accompanied by a parallel system of red/green colors occurring in the yellow region of the spectrum where brightness is maximal (Mullen and Kingdom, 2002). Where the dynamic range of achromatic contrasts are maximal is where chromatic contrast can contribute most to detecting borders when achromatic contrast is minimal. Figure 20 shows how the activity of this trivariant cone system contributes to the variety of major colors we see. The borders of effective energy contrast for each of these colors are minimal, which is where color contrast is especially important.

9. The Cone Mosaic of Trivariant Color Vision
The division of a single L cone type into two spectrally different L and M cones produced a mosaic of L, M and S cones from which each ganglion cell picks out the input of one or the other of these cone mechanisms to transmit to the brain. Adaptive optics has revealed significant differences in the number of L versus M cones in normal subjects (Hofner et al., 2005) (Figure 21).

Some subjects have 15 times as many L than M cones and others have twice as many M than L cones but all have normal color vision. This reinforces the idea that a unit area of color space involves comparisons of large groups of cones. What remains problematic is how midget-like ganglion cells in the parafovea select only L or only M cones to form synaptic contact within this variegated cone field.
10. A parallel system of achromatic ganglion cells
In addition to midget and midget-like ganglion cells described there is another parallel system of larger ganglion cells with less representation in the fovea than the midget cell system (Gouras, 1969). These ganglion cells also have: on- and off-varieties mediated by a separate set of cone bipolar cells and are known to be the “parasol” ganglion cells found by the Golgi method of silver impregnation. They seem to receive their inputs from only L and M cones through a different set of bipolar cells than those serving the midget cell system. Figure 22 shows two retinal ganglion cells in rhesus monkey retina.
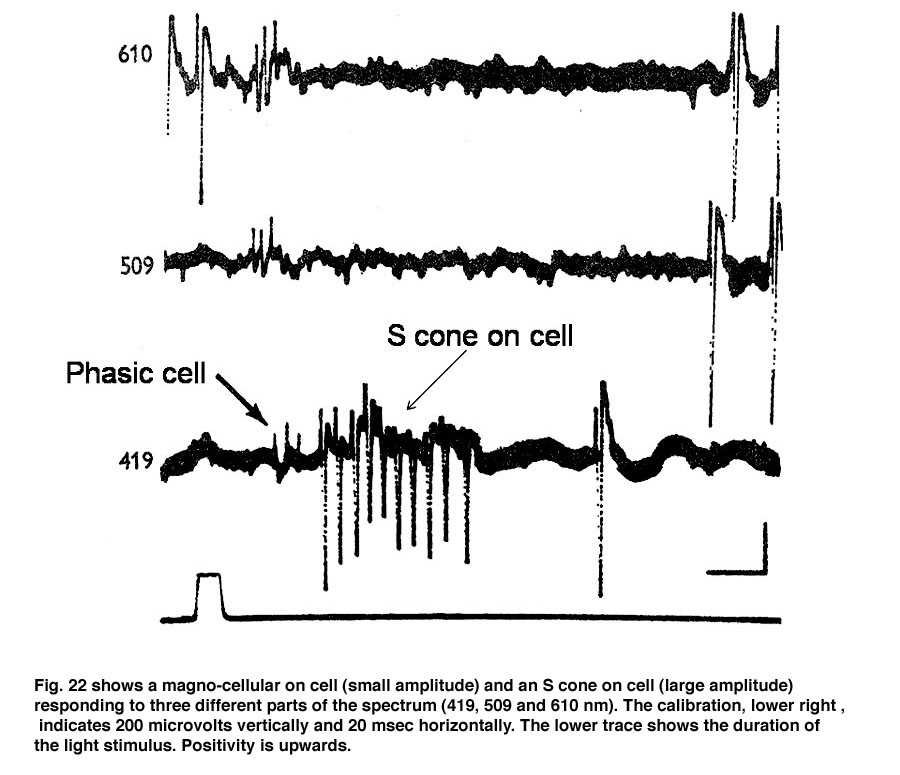
The cell with smaller amplitude is a phasic on-cell that responds at on to all three wavelengths with a shorter latency than the tonic S cone on cell which is excited only by the deep blue light (419 nm) and inhibited by the longer wavelengths (610 and 509 nm). It is thought that a separate relatively wide field bipolar cell feeds these phasic cells. These cells receive similar inputs from both L and M cones and therefore cannot play a role in “red/green” color vision and probably no role in blue/yellow color vision. Figure 23 is evidence that they receive no input from S cones. The threshold spectral function obtained on a strong yellow adapting field shows no evidence of an S cone input. The S cone on-cell has a threshold spectral function that shows it lowest threshold to blue light. The phasic cells have their lowest threshold resembling that of the photopic luminosity function.
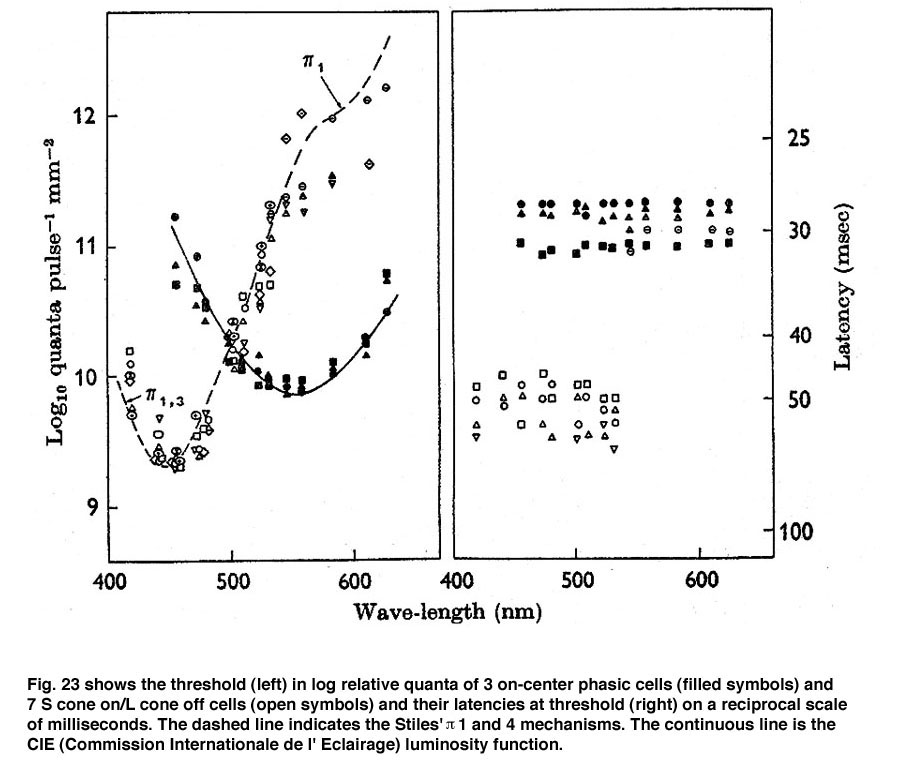
The retinal latencies at of these two types of cells show a significant difference between the tonic and phasic cells indicating a faster transmission of the latter through the inner nuclear layer by the phasic system. In addition the larger size of the axons of the phasic system allows this system to transmit its signals to visual cortex much quicker than the tonic system. The role of the phasic “parasol” ganglion cell system in vision is not entirely clear. It seems to play a role in the detection of motion and to target different areas of visual cortex. Whether it plays any role in color vision is moot.
11. The Lateral Geniculate Nucleus (LGN)
The LGN reorganizes the parallel ganglion cell systems serving local retinal areas into separate layers from where their axons project to specific layers in striate cortex (Martin et al., 1997: Chatterjee and Calloway, 2003, Tailby et al., 2008). Signals from nasal retina of the contralateral eye are separated into different layers from those coming from the temporal area of the ipsilateral eye. This is needed for stereopsis where changes in eye position require comparing signals from different corresponding retinal regions and accordingly different ganglion cells. Binocular interactions begin for the first time in visual cortex. The parallel channels coming from the same retina are also separated into different layers. The phasic achromatic ganglion cell system goes to the magno-cellular layers, one layer for each eye. The midget and midget-like retinal ganglion cells transmitting signals for high resolution achromatic vision and “red-green” color vision are placed in four parvo-cellular layers, two for each eye. The S-cone mediating retinal ganglion cells which are involved in “blue-yellow” color vision go to the konio-cellular layers. These parallel systems of ganglion cells project to specific layers of striate cortex where form, color, movement, direction and stereopsis are processed.
An interesting but unknown role must be played by the numerous centrifugal axons that arise from striate cortical layers and impinge upon the cells in the LGN. Whether this shapes or influences chromatic and achromatic contrasts that are involved in form vision is unknown.
12. Striate Cortex
The LGN transmits its signals to striate cortex, the first visual area (V1) to process visual signals in cerebral cortex. There is a retinotopic order to the projection of these producing a map of the visual field. The map is distorted because the fovea occupies a relatively large area compared to the more peripheral retina. There are columns of cells extending from the upper to the lower layers, one column receiving signals from one eye and a neighboring column receiving signals from the other eye (Figure 24). Within each of these “ocularity” columns there are micro-columns of cells favoring a particular orientation of an extended light stimulus. Together these sets of columns have been called a “hyper-column”. Within each hyper-column there is a local area that receives inputs from chromatic selective cells, i.e. the S cone on and off cells and the L and M cone midget and midget-like cells; these areas have been called “blobs”, and are thought to be where color is processed.
There are six distinct layers extending from an upper layer 1 down to a lowermost layer, 6. The projections from the functionally different layers of the LGN target different layers to synapse on cortical cells (Figure 24).
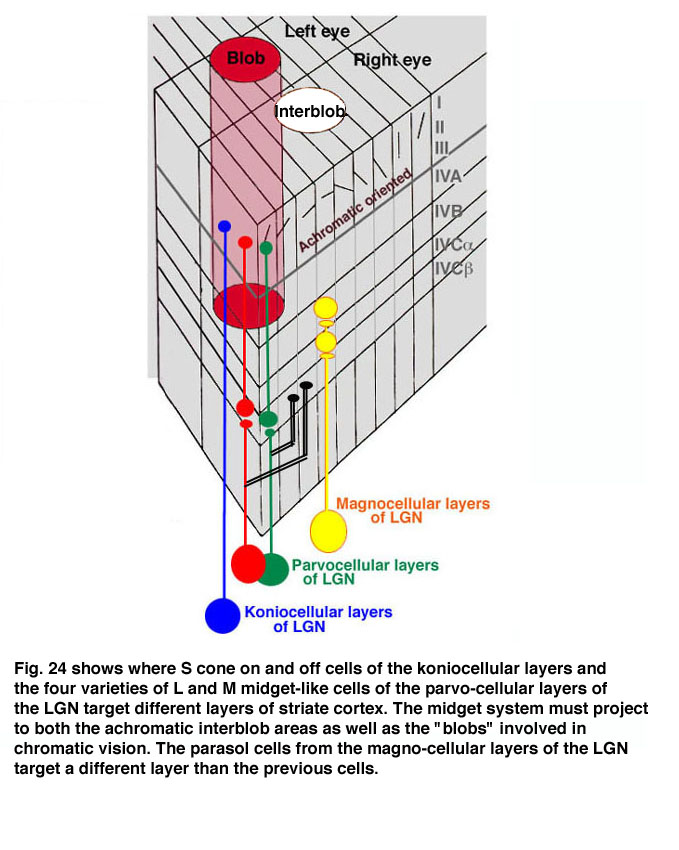
The L and M midget and midget-like cells, projecting from the parvo-cellular layers, synapse in layer 4Cbeta from which their post-synaptic target cells appear to send axons to layer 3 within “blobs”. The S cone system, projecting from the konio-cellular layers, appears to send axons directly to layer 3 within blobs. The fact that the parvo-cellular input, incorporating the L and M cone midget and midget-like cells, makes an intermediary synapse may be due to the double duty role these cells play in handling both achromatic and chromatic vision. The area surrounding blobs process achromatic contrast, undoubtedly receiving their input from the parvo-cellular layers. The magno-cellular layers of the LGN target cells in layer 4Calpha from which postsynaptic cells send axons to layer 4B. Therefore there is segregation of cell systems, some playing a role in chromatic contrast and others playing a role in achromatic contrast and movement. The existence of “double opponent” cells in blobs supports the idea that this zone within each hyper-column is devoted to detecting chromatic contrast for color vision. There are many unknowns in this structure that can only be solved by more single cell physiology combined with anatomical insights into the circuitry. What seems clear is that each unit area of visual space is processed in parallel by achromatic and chromatic mechanisms (Livingston and Hubel, 1987).
13. Pure Spectral Contrast
Double opponent cells tend to eliminate the influence of energy contrast establishing pure spectral contrast as an indicator of the borders of objects. With trivariant color vision this can be formed by comparing L with M cone responses and/or by S cone versus L&M cone responses. Figure 25 illustrates the organization of a “red/green” double opponent cell. The system uses spectral contrast.
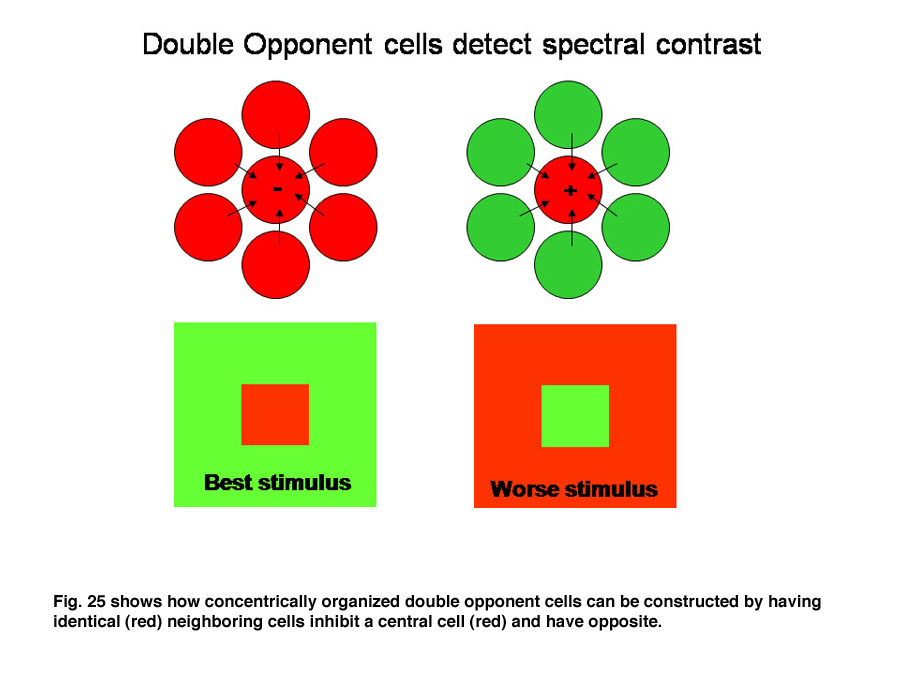
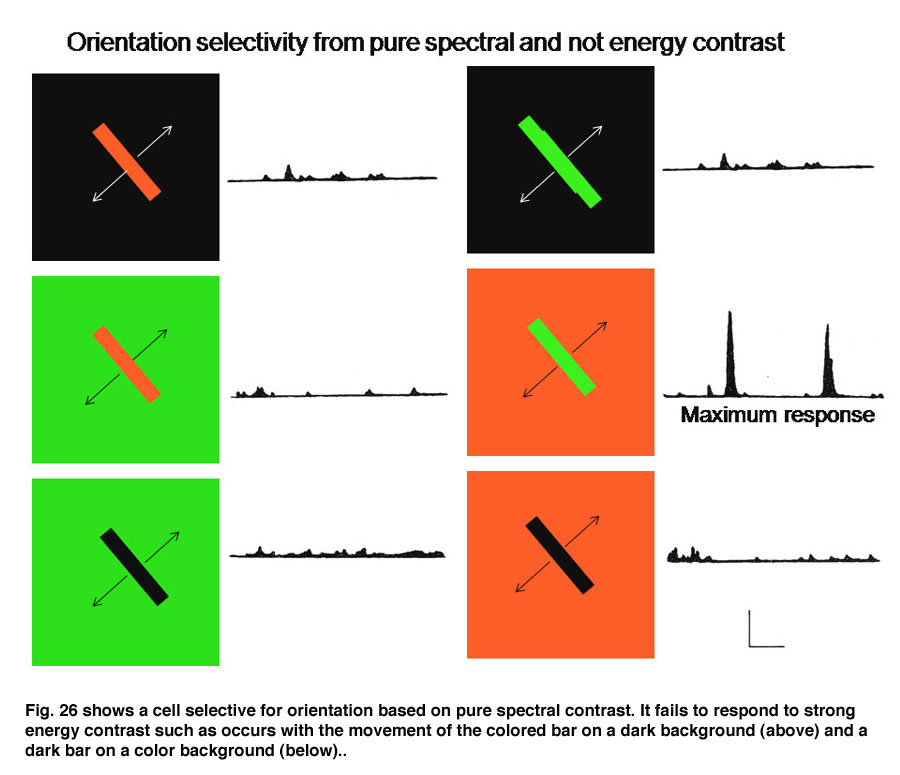
Figure 25 shows how concentrically organized double opponent cells can be constructed by having identical (red) neighboring cells inhibit a central cell (red) and have opposite neighboring cells (green) excite the central cell (red) making it most sensitive to a red central object in a green background and unresponsive to the converse. Such a cell responds to spectral rather than energy contrast as an indicator of a border. This behavior is illustrated by a cell detected in visual cortex that responds exclusively to spectral and not to energy contrast (Figure 26). The stimuli with maximum energy contrasts such as a red or green bar on a black background or a black bar on a green or red background produce no response from the cell. But a green bar on a red background where energy contrast is minimal generates a large response. The brain has now separated the two major forms of contrast, spectral versus energy contrast to use them as independent variables to create color.
14. Simple, Complex and Hypercomplex Double Opponent Cells
One of the remarkable discoveries in visual cortex has been that of a unique body of cells that exhibit definable patterns of responses all based on orientation selectivity. One group called “simple” cells show orientation selectivity which can be predicted by the organization of responses produced within their receptive field. Another group, called “complex” cells, which also show orientation selectivity but are less obviously related to the distribution of responses within their receptive field. A third group, “hypercomplex” cells, are orientation selective but are “end-stopped” being inhibited if the oriented stimulus is too long. These three types of cells are thought to contribute to form vision based on energy contrast. Charles Michael (1981) has shown that a similar group of double opponent cells exist in striate cortex of monkeys. Figure 27 shows such a simple cell responding best to strong spectral contrast.
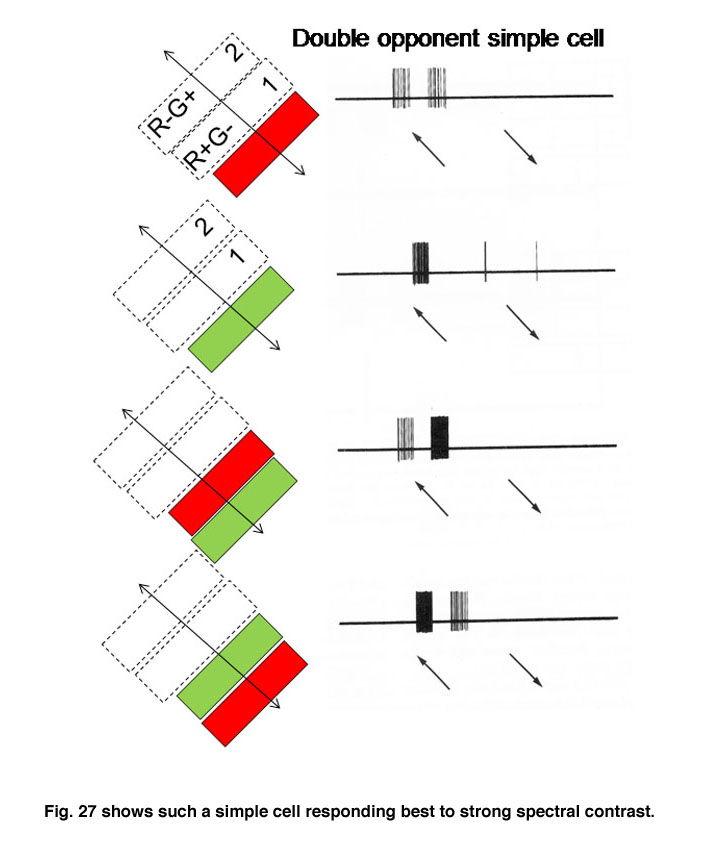
Fig. 27 shows such a simple cell responding best to strong spectral contrast
Figure 27 shows that this cell is excited when an oriented red bar moving upward crosses the red selective area of its receptive field and inhibited when it crosses the green selective area; it produces an off-response when it leaves this green selective area. A green bar produces excitation when it crosses the green selective area only. A green-red and a red-green bar produce strong responses but the responses occur at different points in the receptive field and are therefore totally out of phase with each other. This cell responds poorly to white bars being spectrally selective. Figure 28 shows a complex cell that responds to spectral and not energy contrasts. It is both orientation and directionally selective and refuses to respond to energy but responds strongly to spectral “red/green” contrast.

Fig. 28 illustrates a complex cell responding to spectral contrast but not to energy contrasts
Hypercomplex double opponent cells (Figure 29) are also detectable in striate cortex completing the variety that are based on energy contrasts. Therefore the same repertoire of orientation selective cells responsive to energy contrasts in striate cortex can also be found for spectral contrast. It is thought that both groups of cells play a role in form vision. Parallel systems of cells are detecting the forms of objects, one based on energy and the others based on spectral contrast. Because energy contrasts allow a higher spatial resolution, more of visual cortex is dedicated to achromatic than chromatic contrast detection.
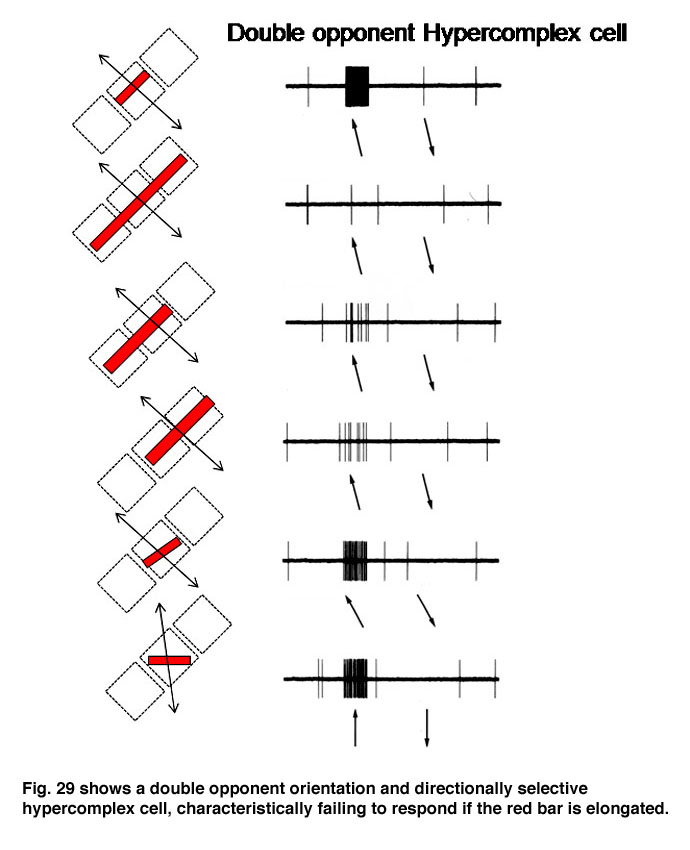
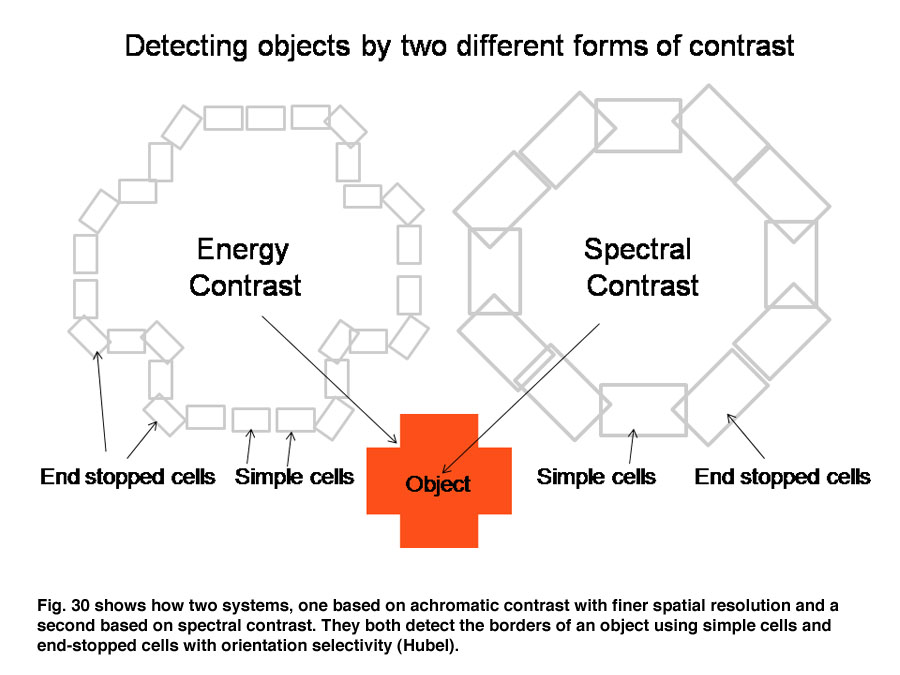
Figure 30 shows how these two parallel contrast detecting systems could work in detecting a red object. Both simple cells of different orientation selectivity can detect the border of this cross, one set based on energy contrast and with a higher spatial resolution and the other set based on spectral contrast and with a lower spatial resolution. Sharp corners in the object would be detected by end-stopped hypercomplex cells. This creates two different views of the object which may be fused into one colored object just as two similar stereoscopic views are fused into an object in depth. Together they create shapes in full color (Figure 30).
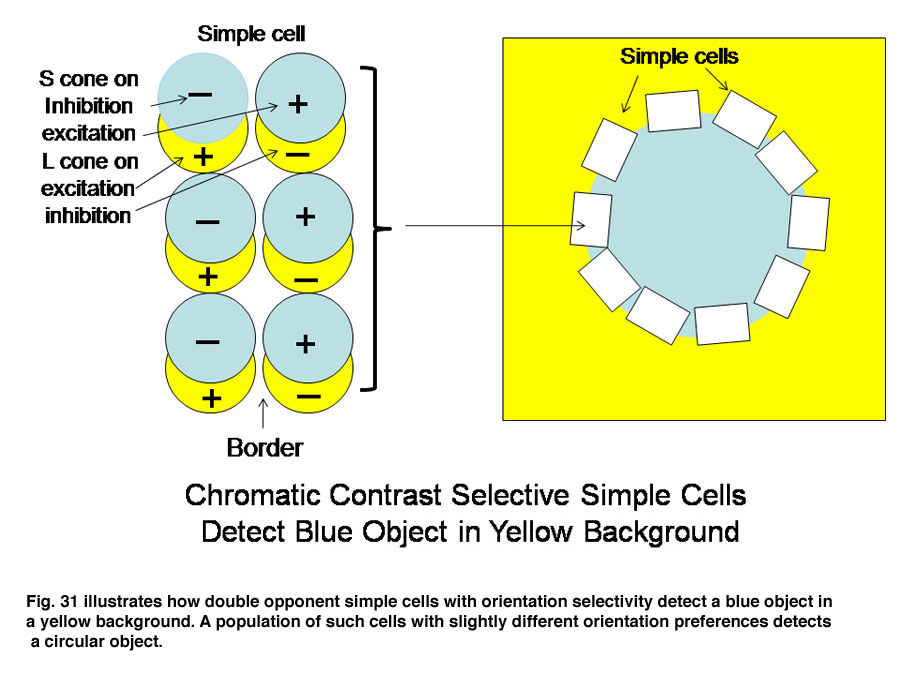
A similar system for using spectral contrast created by double opponent S cone versus L cones or L+M cones must create another spectral view of objects by border contrasts (Figures 31 and 32). In Figure 31 groups of double opponent simple cells detect a circular blue form on a yellow background. In Figure 32, similar simple cells detect a border of contrast between yellow and white, allowing the detection of an object of minimum energy contrast.
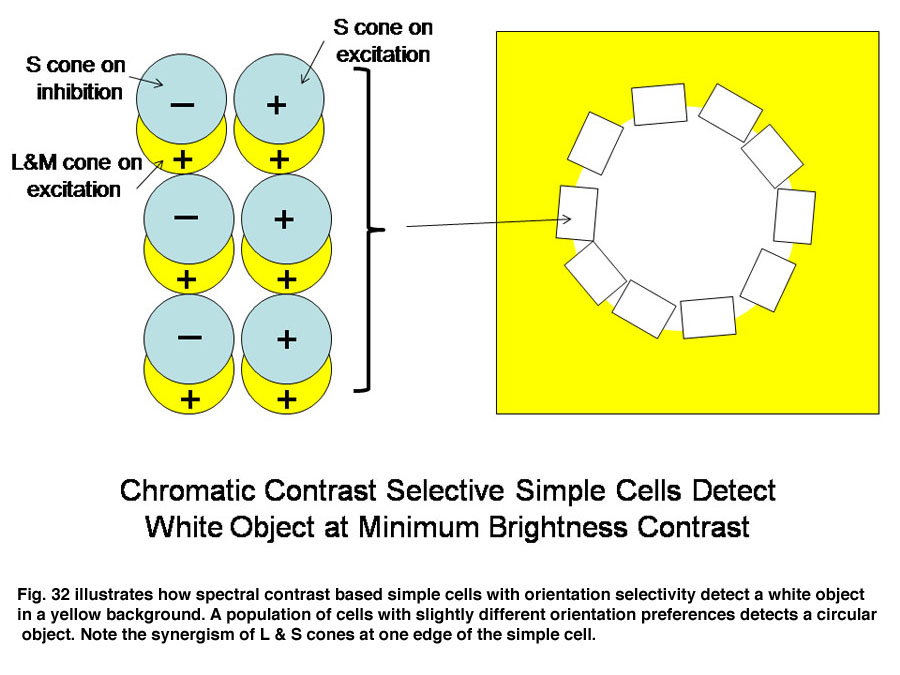
This highlights an important role of the S cone mechanism in vision to detect border contrasts of white versus yellow which are difficult for the achromatic system which is mediated only by L and M cones. This scheme implies that for color vision three different views of the same object are formed and then fused to provide colors that represent mixtures of the red/green and the blue/yellow spectral contrasts systems. If there is no activity in the spectral contrast detectors then only the energy (achromatic) system is active and the object is pure white, gray or black. There are some different views on these ideas. Single opponent cells are thought by Johnson et al, (2008) to detect surface color while double opponent cells detect borders. Others have suggested that neurons involved in the analysis of color should retain their chromatic properties in the face of changes in other components of stimulation, orientation, size and contrast and this may not be the case for color selective neurons found in striate cortex (Solomon & Lennie, 2007).
15. The Stabilized Retinal Image
If an image is made stationary on the retina it will disappear in seconds. Figure 33 illustrates what is perceived by a subject presented with a stabilize image of a red/green boundary based on the research of the Russian physiologist Yarbus (1967) and others (Ditchburn, 1973). Initially the subject sees the red/green scene but in several seconds it fades into a featureless field. If a pale blue light is added to both sides only a blue field is seen without the red/green scene. This also fades within seconds. If the pale blue field is removed the subject sees a faint red/green scene but this fades again. This indicates that we only see in transients determined by change in the retinal image.

If the retinal image does not change in space and/or time, it will disappear. Constant small micro-movements of the eye continue to produce transient changes at the borders of objects that are able to maintain an undiminished view of the external world. This supports the idea that objects are seen because of their borders, as depicted by the orientation selective border contrast cells illustrated previously, which must be continuously moved across the retina to maintain their visibility. Figure 34 illustrates how the responses of on and off cells contribute to maintaining strong responses to movements of borders of contrast. When a long wavelength (red) surface enters the receptive fields of on and off cells, the on-cell (L off) responds more strongly than the off-cell if there is an increment in energy contrast. But the off-cell (M off) will respond more strongly if there is a decrement in energy contrast. These two systems are showing their ability to respond to increments and decrements of energy contrast but also manage to favor long over other shorter wavelengths, which is a key for their role in color vision. M on and L off -cells would respond weakly to such a moving border.

16. Color Vision Beyond Striate Cortex
An intriguing but poorly understood aspect of visual cortex is the remapping of visual space into multiple adjacent visual areas where a retinotopic order is maintained. Figure 33 shows how V1 projects to V2, a second visual area juxtaposed to V1 where there continues to be a segregation of functionally different cells. The “blob” areas of V1 appear to project to “slabs” of cells in V2, which project to “globs” of cells in V4.
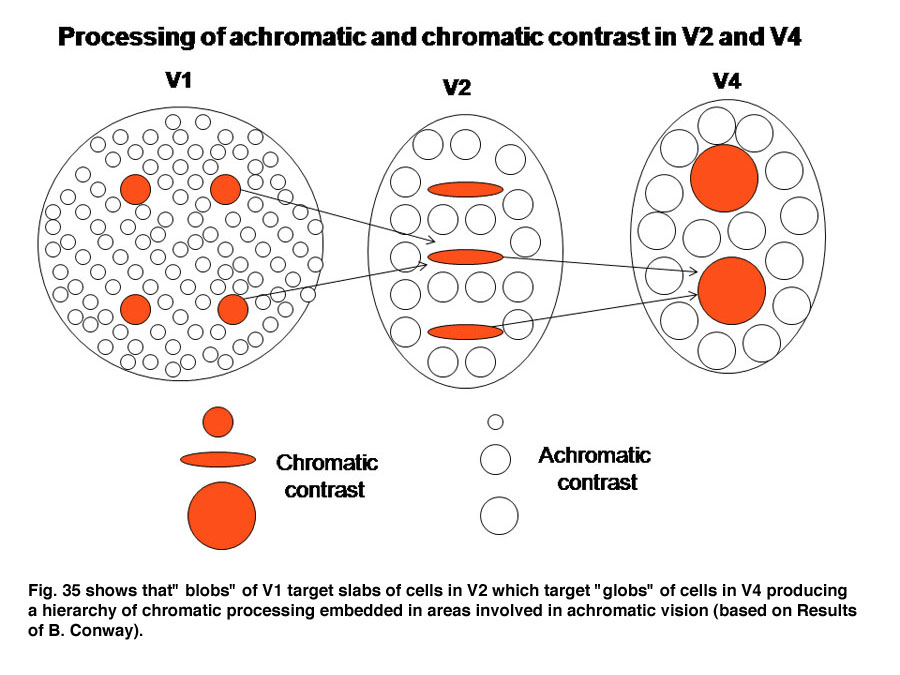
Within these three interconnected areas spectral contrast is processed, presumably to determine its contribution to color, i.e. hue. Adjacent areas processing energy (achromatic) contrasts contribute to determining the saturation and brightness in colors. The achromatic areas are larger because of the higher spatial resolution of energy contrasts. The receptive field sizes of cells in these higher visual areas tend to be larger than they are in V1 suggesting that, several blobs in V1 project to a single slab in V2 and several slabs in V2 project to a single glob in V4 (Conway et al., 2007; 2006; 2002). The functional roles of these higher areas could be to recognize objects better as they come closer to the observer when they cast a larger retinal image. It is known that the perception of color increases with the size of an object over sizes as large as 20 degrees of visual angle. Under ideal conditions i.e. a well lit surface, we can perceive at least a million different colors. Figure 36 shows how more basic hues determined by single cells in blobs could be used to build higher order colors that combine the inputs of the more basic hue determining cells. As one develops more experience with colors even higher order cells could be formed allowing the distinguishing of many different shades of color.
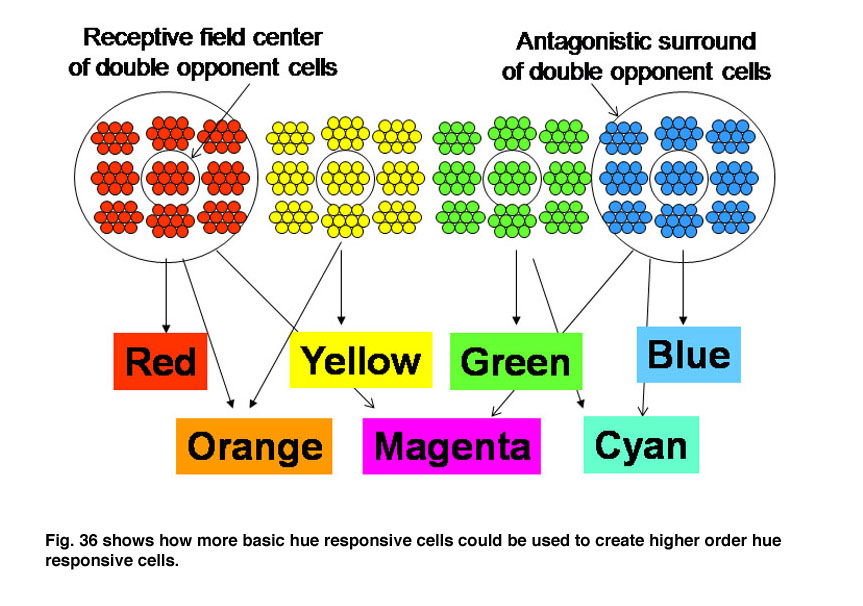
There is a question as to whether a single cell is committed to detecting a particular color or whether a group of cells are involved. This might depend on the practice one has in working with colors such as artists who may form single cells that are sensitive to a particular color and capable of contributing to even higher order colors while those who are less involved have fewer such cells and depend on less fastidious interactions.
There has been a controversy about whether color processing is exclusively segregated to V4 while achromatic processing occurs in another complete area of visual space. Evidence implying this type of organization involves rare individuals who have lost all color vision but can see objects with high spatial resolution in black and white. This hypothesis was championed by Zemir Seki but the existence of “globs” related to spectral contrast in V4 surrounded by larger areas of achromatic contrast detecting cells tends to weaken this idea. Because “globs” are relatively large it was perhaps possible for an investigator making a limited number of penetrations to conclude that all of V4 is devoted to chromatic vision. Nevertheless there must be an explanation of why in these very rare patients color can be lost without a loss in spatial resolution which depends entirely on achromatic contrast. The enigma may be explicable by damage to higher areas of the brain where interpretation and language are involved linking vision to external communication.
17. Redness at short wavelengths
It is well known that short wavelengths can produce a reddish sensation that makes blue appear violet. This affect appears to arise from the beta-band of L cone opsin which makes this opsin more sensitive to light than M cone opsin at this region of the spectrum (see Figure 14). This effect is best observed in midget-like cone opponent retinal ganglion cells which are excited by long wavelengths and inhibited at wavelengths at the middle of the spectrum. In many of these cells excitation appears with short wavelength stimulation implying that the L cone response is overpowering the M cone antagonism. This is supported by the fact the L cone response is strengthened by a blue adapting light, which selectively depresses the responses of M cones. Had this short wavelength excitatory input been due to S cones, it would have been weakened by the blue adapting light.
18. Hering’s Theory of Color Vision
An insightful theory was proposed by Ewald Hering in Prague in 1874 which was resisted by many leading scientists in the field, such as Herman von Helmholtz. Hering noted that the sensations of blue and yellow opposed each other so that when seen simultaneously, the original colors were lost and a new sensation of a totally different color “white” was seen. Similarly the colors red and green exhibited a similar opposing relationship. When mixed they lose all traces of the original colors to create a new sensation “yellow”. Hering suggested that there were two pairs of opponent processes underlying human color vision. This contrasted with the fact that there are only three variables underlying human color vision. This three dimensional system was suggested by Thomas Young (1802) and proven by James Clerk Maxwell (1872) and strongly promulgated by Helmholtz (1852). The Hering theory suggested that there are two pairs of basic colors that have a unique opponent relationship for each pair. He was correct in this analysis although his idea that the opponency between colors was occurring in the photoreceptors was incorrect.
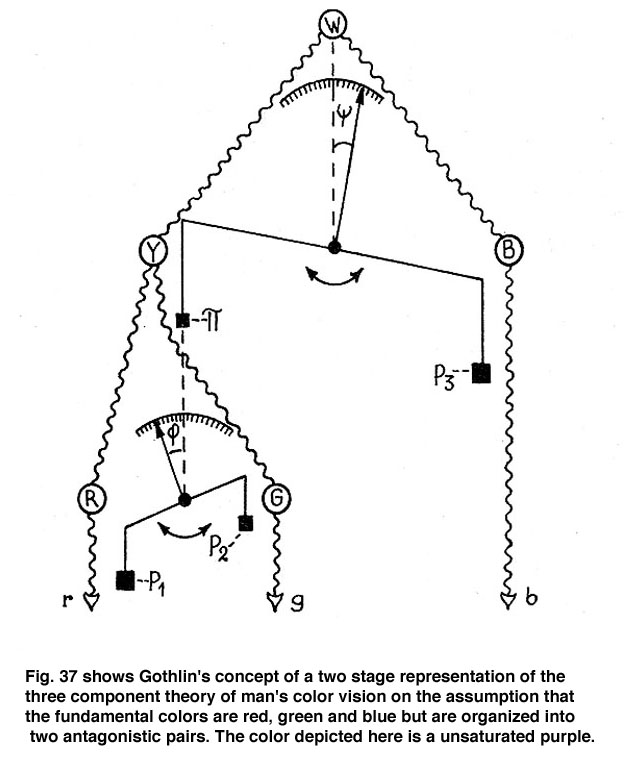
At Hering’s time the understanding of neuro-physiology was poor and the concepts of excitation and inhibition of neurons in unique and complex ways was unknown. The first suggestion that antagonism between colors could be due to excitation and inhibition between nerve cells, that I have found, was in a paper by the Swedish physiologist Gustaf F. Gothlin (1944). He had followed Sherington’s work on the spinal cord where the idea of excitation and inhibition between nerve cells first evolved. Figure 37 shows how prophetic Gothlin’s ideas were. Here he creates an antagonistic balance between blue and yellow processes as a first stage and then hangs a scale on the yellow side of the blue/yellow balance to show an antagonistic relationship between red and green. He predicts that these antagonistic interactions were due to excitation and inhibition between neurons. It is interesting that the pioneer of exploring nerve cell responses to spectral stimuli in the retina, the Nobel Prize winner, Ragnar Granit, also a Swedish physiologist, made no reference of Gothlin’s concept in any of his writings on retinal responses to color.
Granit (1947) proposed a dominator/modular theory of color vision in which there were some retinal neurons which responded to only a narrow part of the visible spectrum, “modulators”, and another group that responded to a broad band of the spectrum, “dominators”. He thought the modulators were more involved in color vision but never mentioned the concept of excitation and inhibition between colors or cone mechanisms as Gothlin did. The first American studies of single visual neuron responses to monochromatic stimuli were obtained in the monkey’s lateral geniculate nucleus by Russel DeValois and associates in 1958. They emphasized the presence of narrow-band responding cells resembling the modulators of Granit but they also noted some cells that gave on responses to red and off responses to green light but again Hering’s concept of opponent colors was not mentioned. The experiments that brought Hering’s opponent color theory to the forefront were done in fish retina by another Swede, Gunter Svaetichin (1956) using glass instead of metal electrodes, enabling him to record intra-cellularly from horizontal cells. This allowed him to see both depolarizing and hyperpolarizing responses, the latter not obvious with extra-cellular recordings, where one sees only a silence or perhaps an off response from inhibition (hyperpolarizing) which could easily be overlooked. Svaetichin’s results gave rise to a resurgence in Hering’s opponent color theory (Hurvich and Jamison, 1957; Hurvich, 1981). This quickly led to the idea that there were three retinal channels representing Hering’s color opponent channels, red opposing green, yellow opposing blue and white opposing black. This idea, however, was short lived. First of all it became apparent that the red/green opponent cells had concentrically organized receptive fields with the color opponent inputs coming from adjacent retinal regions. One would expect the color opponent signal should involve the same area of visual space and not neighboring areas. In addition the red-green opponent ganglion cells seemed to be the midget cell system which was the logical mediator of high spatial resolution. This created a dilemma in having a red/green color opponent channel carrying achromatic information for high spatial resolution. In addition the S cone channel was opposed by yellow light but not strongly enough to stop responses to white. The S cone on ganglion cells appeared to be transmitting a signal that said that the S cones were absorbing light but not that this light was “blue”; it could be white, grey as well. The so called white/black channel was receiving no input from S cones which is not what is expected for a channel signaling white. The contribution of activation of the S cone retinal ganglion cells is illustrate by the after images produced in Figure 38.

Therefore the link between Hering’s opponent color theory and retinal ganglion cell signals was scrapped. Because the neurons in the lateral geniculate nucleus responded similarly to what was found in the retina, attention went to striate cortex to explain opponent color theory by physiology. The initial ideas of channels signaling color at the retinal level were wrong; the opponent signals detectable in the retina were cone opponent and not color opponent. Color vision turned out to be more sophisticated, more arcane but more realistic.
19. The Future
Certainly the future will involve anatomical definition of how the projections from the lateral geniculate synapse in striate cortex and begin to define the neurocircuitry of this hexalaminar cortical structure. The dendritic input and axonal output of each functionally unique cell must be defined as has been done to a large degree in the retina. This strategy must be repeated in higher areas of visual cortex, perhaps the most intriguing phase of this crusade. New optical techniques that combine both anatomical identification and physiological responses of the same cells could expedite this enormous task. But this is the only way to understand how the most complex machine in our universe, the cerebral cortex works. For this color vision is an ideal starting point because it has carried us further into this organ than any other neural process.
20. References
Chatterjee S, Callaway EM. Parallel colour opponent pathways to primary visual cortex. Nature. 2003;426:668–671. [PubMed]
Conway BR, Hubel DH, Livingstone MS. Color contrast in macaque V1. Cereb Cortex. 2002;12:915–925. [PubMed]
Conway BR, Livingstone MS. Spatial and temporal properties of cone signals in alert macaque primaryvisual cortex. J Neurosci. 2006;26:10826–10846. [PubMed]
Conway BR, Moeller S, Tsao DV. Specialized color modules in Macaque extrastriate cortex. Neuron. 2007;56:560–573. [PubMed]
Dacey DM, Lee BB. The “blue-on” opponent pathway in primate retina originates from a distinct bistratified cell type. Nature. 1994;367:731–735. [PubMed]
Daw NW. The psychology and physiology of colour vision. Trends in Neurosci. 1984;7:330–335.
De Valois RL, Smith CJ, Kitai ST, Karoly AJ. Responses of single cells in monkey lateral geniculate nucleus to monochromatic light. Science. 1958;127:238–239.[PubMed]
Ditchburn R. Eye Movements and Visual Perception. Claredon Press; 1973.
Ekesten B, Gouras P. Cone and rod inputs to murine retinal ganglion cells: Evidence of cone opsin specific channels. Vis Neurosci. 2005;22:893–903. [PubMed]
Gothlin GF. Interaction of excitatory and inhibitory processes in the synthesis of the sensation of colour and of white. Upsala Lek refurenings Furhandlingar. 1944; 49: 433-446.
Gouras P. Antidromic stimulataion of orthodromically identified ganglion cells in monkey retina. J Physiol. 1969;204:407–419. [PubMed]
Granit R. Sensory Mechanisms of the Retina. London: Oxford University Press; 1947.
Haverkamp S, Wassle H, Duebel J, Kuner T, Augustine GJ, Feng G, Euler T. The primordial, blue-cone color system of the mouse retina. J Neurosci. 2005; 25:5438 -5445.22:3831-3843.
Helmholtz HLF von. Handbuch der Physiologischen Optik, 2nd edition. Hamburg: Voss. (3rd edition, Hamburg:Voss, 1909); 1852.
Hering E. Outlines of a theory of the light sense (translated by Leo M Hurvich and Dorothea Jameson). Cambridge (MA): Harvard University Press; 1964.
Hofer H, Carroll J, Neitz J, Neitz M, Williams DR. Organization of the human trichromatic cone mosaic. J Neurosci. 2005;25:9669–9679. [PubMed]
Hubel DH. Eye, Brain and Vision. NY: Scientific American Library; 1988.
Hurvich L. Color Vision. Sunderland (MA): Sinauer Associates; 1981.44.Hurvich LM, Jameson D. An opponent-process theory of color vision. Psychol Rev. 1957;64:384–404. [PubMed]
Jacobs GH. Primate color vision: a comparative perspective. Vis Neurosci. 2008;25(5-6):619–33. [PubMed]
Johnson EN, Hawken MJ, Shapley R. The orientation selectivity of color-responsive neurons in macaque V1. J Neurosci. 2008;28:8096–8106. [PubMed]
Kolb H. Anatomical pathways for color vision in the human retina. Visual Neurosci. 1991;7:61–74.
Land EH. An alternative technique for the computation of the designators in the Retinex theory of color vision. Proc Natl Acad Sci USA. 1986;83:3078–3085.[PubMed]
Lee BB. Neural models and physiological reality. Vis Neurosci. 2008;25:231–41. [PubMed]
Livingstone MS, Hubel DH. Psychophysical evidence for separate channels for the perception of form, color, movement and depth. J Neurosci. 1987;11:3416–68.
Martin PR., White AJR, Goodchild AK, Wilder H D, Sefton A E. Evidence that blue-on cells are partof the third geniculocortical pathway in primates. Eur. J. Neurosci. 1997;9:1536–1541. [PubMed]
Maxwell JC. On colour vision. Proc R Inst. Great Britain. 1872; 6:260-271.
Michael CR. Columnar organization of color cells in monkey’s striate cortex. J Neurophysiol. 1981;46:587–604. [PubMed]
Mollon JD. “Tho’ she kneel’d in that place where they grew. . .” The uses and origins of primate colorvision. J Exp Biol. 1989;146:21–38. [PubMed]
Mullen KT, Kingdom FA. Differential distributions of red-green and blue-yellow cone opponency across the visual field. Vis Neurosci. 2002;19:109–118. [PubMed]
Neitz J, Neitz M. Colour vision: the wonder of hue. Curr Biol. 2008;26(18):R700–702.
Nelson R, Famiglietti EV, Kolb H. Intracellular staining reveals different levels of stratification for on-center and off-center ganglion cells in the cat retina. J Neurophyiol. 1978;41:427–483.
Packer O, Verweij J, Schnapf JL, Dacey DM. Primate S cones have blue-yellow opponent receptive fields. Invest Ophthalmol Vis Sci. 2007;48:2849.
Polyak, SL. The Retina. Chicago: Univ. Chicago Press; 1941.
Rodieck RW. The primate retina. In: Comparative Primate Biology Series, Volume 4: Neurosciences (eds. Steklis H and Erwin J). New York: Alan R. Liss. 1988; pp. 203-278.
Solomon SG, Lennie P. The Machinery of Colour Vision. Nature Reviews Neurosci. 2007;8:275–286.31.Yarbus AL. Eye Movements and Vision. New York: Plenum Press; 1967.
Stiles WS. Increment thresholds and the mechanisms of colour vision. Dcoumenta Ophth. 1949;3:138–165.
Tailby C, Szmajda BA, Buzas P, Lee BB, Martin PR. Transmission of blue (S) cone signals through the primate lateral geniculate nucleus. J Physiol.2008;586:5947–67. [PubMed]
Wright WD. Researches on Normal and Defective Colour Vision. London: Henry Kimpton; 1946.
Yin L, Smith RG, Sterling P, Brainard DH. Physiology and morphology of Color-Opponent ganglion cells in a retina expressing a dual gradient of S and M opsins. J Neurosci. 2009;29:2706–2724. [PubMed]
Young T. On theory of light and colours. Phil Trans R Soc. 1802;92:12–48.
Seki Z. A vision of the brain. Oxford: Blackwell Scientific Publications; 1993.
Last Update: July 1, 2009.
|
The author Peter Gouras was born in Brooklyn, New York. He received an MD degree from Johns Hopkins University School of Medicine and proceeded directly into a career in eye research at the National Institutes of Health, as part of the Public Health Service, at first in the Neurological Institute and the Division of Blindness and later in the National Eye Institute. Dr. Gouras is renowned in 3 areas of vision research all of which he has been a pioneer and leader. For most of his career he has been active in the fields of basic and clinical research on the ERG. In the late sixties he pioneered recordings of primate ganglion cells in the fovea and did pivotal work on the analysis of color pathways from retina through LGN to visual cortex. On his moving to the faculty of Harkness Eye Institute at Columbia Medical School, New York City, in the mid 1970s, Dr Gouras made daring strides into the area of pigment epithelium transplantation for the treatment of retinal and macular disease. He is the author of several hundred papers and many chapters and books particularly concerning color vision and retinal information processing. |
