Helga Kolb
1. General characteristics.
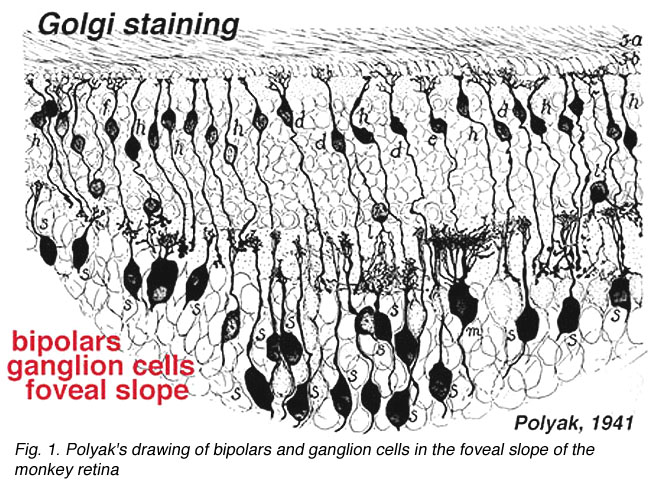
The specialized cone pathways of the central fovea of human and monkey retinas have the least convergence and the greatest resolution capabilities of the visual system. This is accomplished by making the connections as “private” as possible and narrowing them to a one to one relationship in the so-called midget pathways. Figure 1 shows an older drawing from Polyak’s book (!941) that shows the very narrowest field bipolars and ganglion cells of the fovea.
The midget pathways consist of midget bipolar cells and midget ganglion cells, the latter of which project to individual parvocellular layer cells of the lateral geniculate nucleus in the brain. Because of the need for the high acuity midget pathways also to be organized into ON- and OFF-center channels like the diffuse cone pathways for maximization of contrast, it means that every cone of the fovea will have dual midget pathways. The two midget bipolars will be an ON-center type and an OFF-center type and will connect with ON-center and OFF-center midget ganglion cells respectively. Because midget bipolar/ganglion cell circuits are devoted to a single cone, and the individual cones are of different spectral type maximally excited by short (S-cone/blue), medium (M-cone/green) or long (L-cone/red) wavelengths, they must carry sensitivity information about one wavelength. Thus the midget system concerned with the M- and L-cones in particular are considered also to carry L- or M-signals to the brain where further processing takes place to allow us the red and green discriminations of color vision.
The S-cone system is rather different from the M- and L-cone systems from the initial level of the cone itself to its circuitry though the retina and into the brain. We do not consider the S-cone pathway as a midget pathway (see later chapter on S-cone pathways). So this chapter is devoted to the M- and L-midget pathways and as we shall see, they carry both a resolution and a chromatic message through the retina to the brain.
2. Visual acuity starts with cone spacing and midget circuitry.
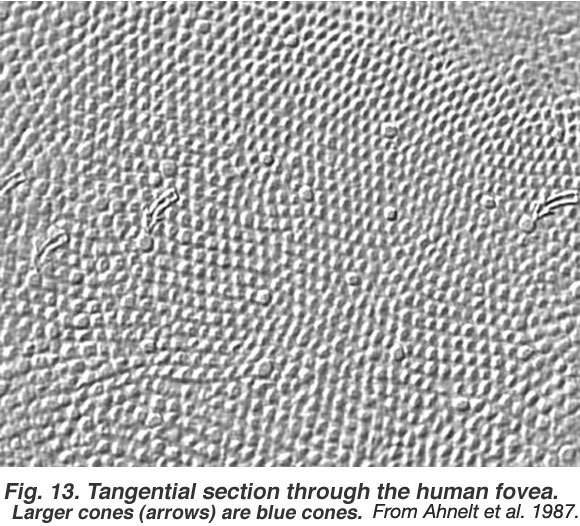
Visual acuity is a measure of our ability to discriminate the finest detail: either by discriminating two parallel lines apart (Vernier acuity) or two tiny spots or stars apart (point discrimination). The primate and human visual system is capable of acuity of 1 min of arc or 60 cycles/degree of visual angle. One degree of visual angle is thought to cover approximately 280-300 um of retinal distance (Drasdo and Fowler, 1974). The area of the retina where the cone photoreceptors are most closely packed in a more or less hexagonal array, is, of course, the center of the fovea and is about one degree across (Fig. 2). So visual discrimination of 1 min of arc is about the center to center spacing (3 µm) of the cones of the central mosaic in the foveola (Fig. 3).

If the minimum center to center spacing (a) is 3 µm for the cones of the fovea, then the grating resolution limit, known as the Nyquist limit, is a√3, about 1 min of arc. One may ask why the grating resolution is not better than 1 min of arc and the size of, or even less than the diameter of each cone, i.e. a or < a. For these narrower gratings, the spatial interference of the packed cones would apparently cause Moire effects, or aliasing, if line separations of less than a√3 are used, as shown below (Wässle and Boycott, 1991) (Fig. 4). These interference patterns, with a repeat length that depends on the angle that the grating makes with the cone mosaic, make it impossible to determine the wavelength of the grating. It turns out that under normal conditions, the optics of the eye do not sharply image gratings of greater than 60 cycles/degree (Cambell and Gubisch, 1966). The optical blur of the eye minimizes Moire effects in spatial sampling (Fig. 4).
The image is also blurred by the optics of the eye to project onto about 10 cones (Fig. 4). Lateral shifts of this image can then be compared over these 10 cones and their midget chains of neurons for later computation in the brain. This allows better discrimination (resolution) because of the possibility of imposing antagonism from neighboring cone systems, i.e. surrounds on the pathways and increasing contrast and discrimination between the several midget-single-cone originating pathways (Gouras, 1992).

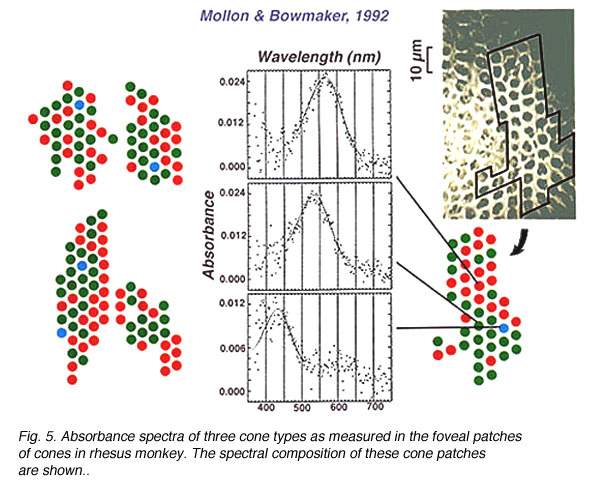
We know that three classes of cone comprise the cone foveal mosaic, but we have long been curious as to how the three different spectral types of cone are arranged in the hexagonal mosaic. The S-cones (blue cones) are fairly easily picked out from the L-cones (red cones) and M-cone (green cones) on some distinguishing morphological features (see chapter on S-cone pathways). In fact the S-cones are seen as the larger profiles disrupting the hexagonal mosaic in the wholemount view of the foveal mosaic of Figure 2 (arrows point to S-cones). In the foveal region of the cone mosaic S-cones form from 8-12% of the cones (Ahnelt et al., 1987). The very center of the foveal pit is almost devoid of S-cones. So the remainder of the cones are somehow divided into the L- and M-cone populations. In the human fovea, psychophysical measurements have suggested that red cones outnumber green by 2:1 (Cicerone and Nerger, 1989). However, direct measurements by microspectrophotometry of all cones in small patches of cones in the fovea of monkeys, has revealed that red and green cones occur in about equal proportion (Fig. 5) (Mollon and Bowmaker, 1992). Roorda and Williams (1999) made direct measurements of spectral sensitivity of foveal cones in the living human eye by a sophisticated technique of adaptive optics to increase spatial resolution. They found that humans varied greatly in their proportions of red cones to green cones: some individuals have almost equal proportions while others have a higher proportion of red cones to the extreme of 2 red cones to every green cone. The red and green cones lie randomly in the mosaic meaning that clusters of cones of the same spectral type will occur together as illustrated in the figure (Fig. 5, below) from Mollon and Bowmaker’s paper. An interesting point can be deduced from these findings. It does appear possible then, that a multiheaded midget or diffuse cone bipolar with a small dendritic tree, could contact all the same spectral type of cones in the primate fovea.
3. Cone to midget bipolar cell connections.
Polyak (Fig. 6) had already described two types of midget ganglion cell in the primate retina in 1941. He had studied and drawn ganglion cells from vertical sections of Golgi-stained monkey retina and noticed that the midget ganglion cells in particular (although it is also true of the small and large parasol ganglion cells) had dendrites branching at one of two levels in the IPL: close to the ganglion cell bodies (the area we now know as sublamina b) or in neuropil close to the amacrine cell bodies (the area we now know as sublamina a).
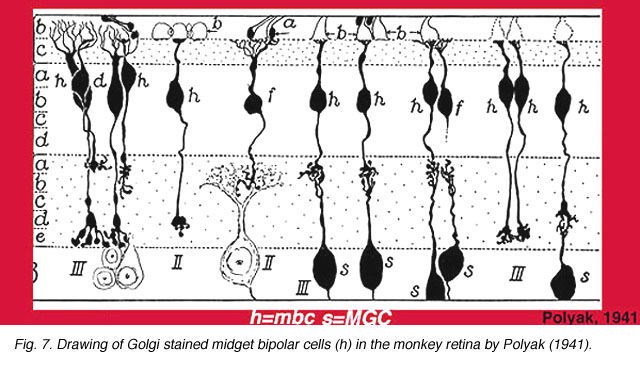
He had also drawn and remarked on the fact that midget bipolar cells came in long and short axon varieties to fit the two midget ganglion cell varieties (Fig. 7) (Polyak, 1941).
Figure 7. Drawing of Golgi-stained midget bipolar cells (h) in the monkey retinaby Polyak, 1941
The important distinction between two types of midget bipolar cell was not made until an electron microscope study was able to show differences in their synaptic contacts with the cone pedicle (Kolb, 1970).
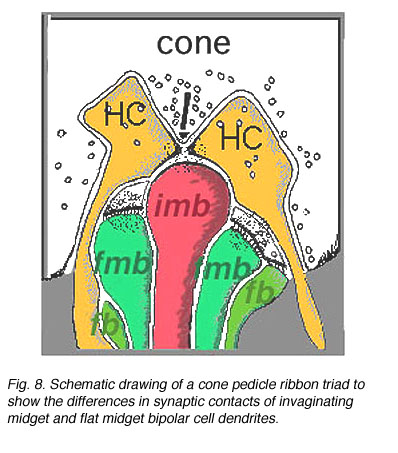
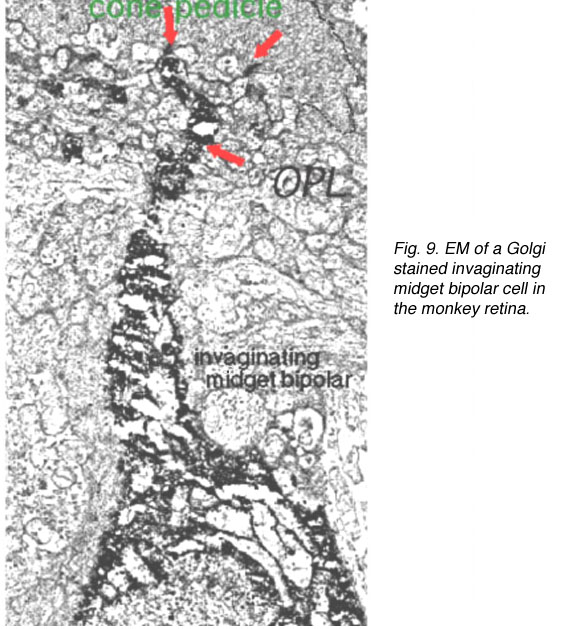
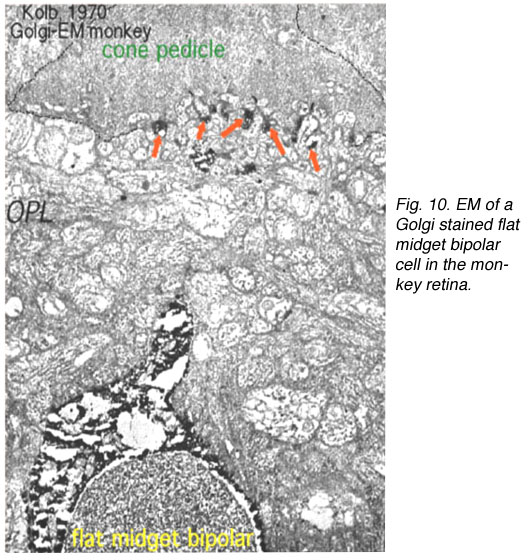
Thus, invaginating midget bipolar cells (imb) were found to connect with cone pedicles at central element, invaginating synapses at the cone pedicle ribbons (Figs. 8 and 9). Flat midget bipolar cells connect to cone pedicles at wide-cleft, basal junctions (fmb), most often on either side of the invaginating dendrite of the imb (Figs. 8 and 10).
4. Midget ganglion cells.
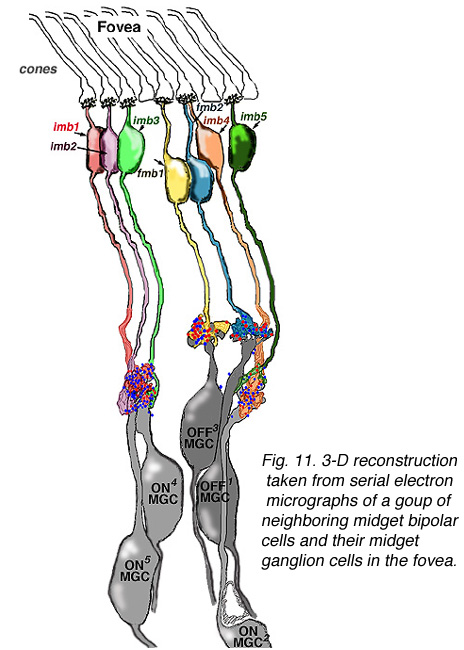
Viewing Golgi stained wholemount primate retinas has been particularly helpful in revealing the differences between the three ganglion cell types that are involved with spatial and color vision: namely the midget ganglion cells, the blue/yellow ganglion cells and the parasol ganglion cells (Polyak, 1941; Kolb et al., 1992; Dacey and Lee, 1994). The midget ganglion cells are thought to be high acuity cells that also carry a red or green color specific signal. They project to the parvocellular layers of the lateral geniculate nucles and are thus called P cells (Fig. 11) (Shapley and Perry, 1986). Midget ganglion cells come in high branching varieties that are probably OFF-center physiologically and low branching types that are ON-center physiologically.

CLICK HERE to see a focus series of two Golgi stained P or midget ganglion cells in human retina (Quicktime movie). A pair of Golgi-stained human midget ganglion cells, including both an ON and an OFF type shows the different dendritic branching levels in retinal flatmount view.
Figure 11 shows two midget ganglion cells in comparison with a parasol ganglion cell (M cell) of peripheral human retina. The one midget ganglion cell has an 18 um diameter dendritic tree and the other has a larger dendritic field at 35 um in diameter. The movie above shows that the midget ganglion cell with the smaller dendritic field comes into focus at a different level from the larger field cell. The former midget ganglion cell branches high in the IPL and so is probably an OFF center type physiologically. The lower branching midget ganglion cell with the larger dendritic tree is probably an ON center type. Why the OFF center type has a smaller dendritic tree compared with ON center type remains a mystery at present but one implication may be that the midget OFF system acuity is higher in acuity than the ON system (Kolb and Marshak, 2001).
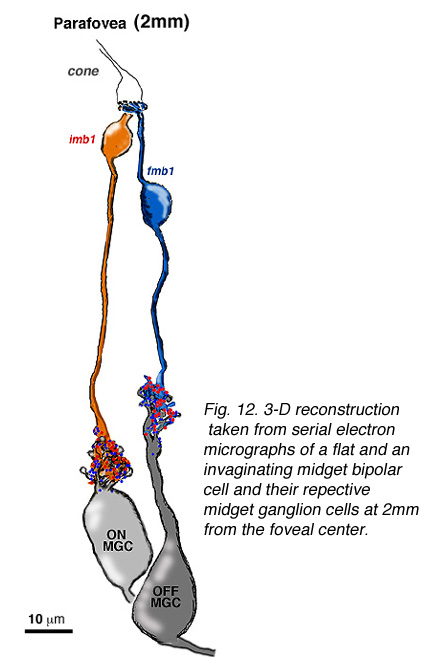
The connections between the midget bipolar and the midget ganglion cells have always been thought to be “private”, i.e. one to one. Because of the similar size and branching level of the axon terminal of the bipolar and the dendritic arbor of the midget ganglion cell in the foveal area particularly, it has been assumed that axon terminal and dendritic field overlap and synapse with no room for convergence from more than one bipolar axon per ganglion cell. However, the story may be different in the peripheral retina where the midget ganglion cells have larger dendritic fields. Obviously more than one midget bipolar axon could fit the dendritic tree of the receiving peripheral midget ganglion cell as seen in Figure 12.

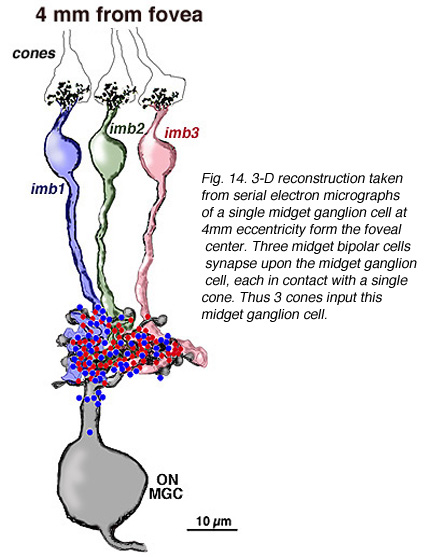
The one to one relationship was positively proven to be the case in the parafoveal area by an electron microscope study and reconstruction of serially sectioned midget ganglion cells and their input midget bipolar cell axons in parafovea, about 2 mm from the foveal pit (Fig 14) (Kolb and DeKorver, 1991). More recently we have also performed a serial section electron microscope study of foveal midget bipolar axons and their connections with the dendrites of foveal midget ganglion cells (Fig. 13) (Kolb and Marshak, 2003)


The respective midget bipolar cells are almost solely synaptic upon single midget ganglion cells (Fig. 14), except in the very central fovea where a few midget bipolar synapses are shared with neighboring midget ganglion cells because of the crowding of neurons and neuropil (Fig. 13). Since we know (Nelson et al., 1978) that ganglion cells branching in sublamina a will be OFF center and those branching in sublamina b will be ON center we can be sure that midget ganglion cells branching close to the amacrine cell layer will be OFF center and those branching close to the ganglion cell layer will be ON center. This ON and OFF midget ganglion cell organization in primate has now been proved conclusively by Dacey and coauthors (2000). So it appears that in the foveal region and out to the borders of the central retina (about 4 mm from the fovea center) the midget pathways of the human fovea are organized in the following manner: 1 cone to 2 midget bipolar cells (ON- and OFF-center bipolar types) to 2 midget ganglion cells (ON- and OFF-center ganglion cell types).
What we find more difficult to say is what spectral type of cone is connected in the midget bipolar to midget ganglion cell chain. M- and L-cones are indistinguishable anatomically. Where we can recognize S-cone (blue) pedicles on unusual morphological features (Ahnelt et al., 1987, 1990; Kolb et al., 1997) (see chapter on S-cone pathways), the M- and L-cones look the same. There is some evidence that M- and L-connected midget bipolar cells have different numbers of synaptic ribbons associated with their axons and therefore different quantities of output sites to their midget ganglion cell in the fovea (Calkins et al., 1994): but which axon terminal/ganglion cell pair is associated with M- or L-cone pathways is still a moot question.
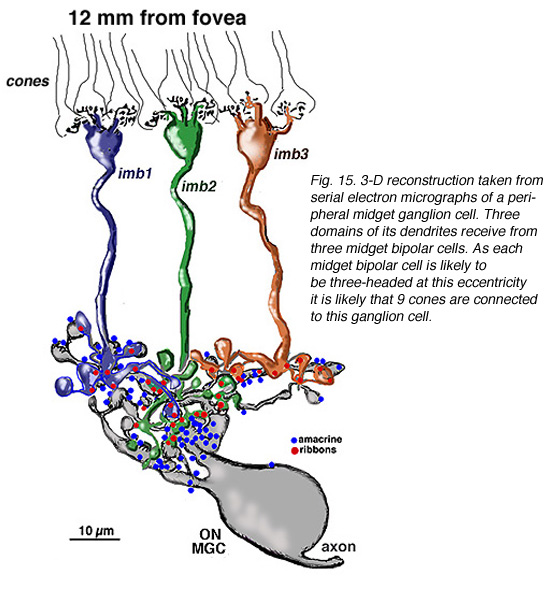
Four to five millimetres beyond the fovea, in near periphery, the midget bipolar cells become 2- and 3-headed connecting to 2 and 3 cones respectively (Polyak, 1941; Kolb et al., 1992; Boycott and Hopkins, 1991). Midget ganglion cells are found throughout the near and mid peripheral retina (Polyak, 1941; Rodieck et al., 1985; Dacey and Peterson, 1992; Dacey, 1993; Kolb et al., 1992) and their dendritic trees increase in size but are often composed of several domains of dendrites. The further peripheral it gets, the more domains of dendrites compose the dendritic tree of midget ganglion cells. So it seems likely, that more than one midget bipolar cell will synapse upon each midget ganglion cell, probably each bipolar occupying one of the domains of the dendritic tree.
Serial section electron microscopy and reconstruction of axons and dendrites of midget ganglion cells at the edge of the central area (i.e. 4 mm from the foveal center) and from peripheral retina (12 mm from the foveal center) indicates that the prediction of multiple input from cones to midget bipolar cells, and multiple inputs from midget bipolar cells to midget ganglion cells is correct in peripheral retina (Figs. 15 and 16). Our estimation (Kolb and Marshak, 2003) is that 3 midget bipolars synapsing on a single ganglion cell 4 mm from the fovea (Fig. 15) (Kolb and Marshak, 2003). Even more convergence of midget bipolar cells to midget ganglion cells occurs in far peripheral retina where we estimated at least 3 multi-headed midget bipolars synapses on a single midget ganglion (Fig. 16).


In the fovea where a single cone connects with its midget bipolar and midget ganglion cell system, the pathway will of necessity be carrying a single color receptive field center. Beyond the fovea where the midget pathway is 2 and 3 channeled and/or many midget bipolars have input, will the midget ganglion cell’s center may be a mixture of cone color types. Despite the patchy and random nature of the red and green cone mosaic and multiple midget bipolar inputs, does the midget ganglion cell retain a dominant committment to one spectral class of cone and thus a color opponent center surround organization? This is in fact what is concluded in both physiological (Martin et al., 2001; Reid and Shapley, 1992) and the most recent functional connectivity report from Chichilnisky’s group (Fig. 17) (Field et al., 2010).
Figure 17 shows the results of midget ganglion cell measurements with multielectrode recordings and high resolution stimulation of single cone types included in these ganglion cells’ receptive fields. Although both red and green cones input the cell, single spectral type of cone i.e. either red types or green types, dominate the receptive field centers (Fig. 17, white outlined, and white lines).

5. Circuits underlying red and green color opponency in the human retina.
Midget ganglion cells of the monkey retina (presumably also of human retina) are known to respond to light with an opponent chromatic organization in their surround (Gouras, 1968, Gouras, 1991; Dacey and Packer, 2003, for a review) (Fig. 18). That is, midget ganglion cells of central retina, when recorded from electrophysiologically, have the smallest receptive fields, and are organized as L-cone ON or OFF center, and M-cone ON or OFF center. Each midget ganglion cell type has a larger surround of the opposite polarity and the opponent color. The surrounds of the midget ganglion cells, as Chichilnisky’s group have elegantly shown (Field et al., 2010), That the surround is comprised of many red and green cone inputs, suggesting non-specific, but mixed spectral input to surrounds (Fig. 17, e) to g) (black lines).
 Figure 18. Color-opponent units as recorded in monkey retina. The illustration is from Gouras, 1968 (28). |
The parasol varieties of ganglion cells are the non-color opponent phasic varieties of ganglion cell recorded in the retina (Gouras, 1968) and are also called M cells projecting to the lateral geniculate nucleus (Shapley and Perry, 1986; Wiesel and Hubel, 1966; Gouras, 1992 for a review). A smaller field, tonic and not clearly color opponent ganglion cell type is also recorded in the retina and parvocellular layers of the geniculate nucleus (Fig. 18) (Gouras, 1992). Whether these are the minority extrafoveal midget ganglion cells that are no longer color specific like some of the cells in the Field et al., study (2010) remains to be seen.
The opponent color surrounds recorded in midget ganglion cells (Gouras, 1968) provide color and spatial opponency. It appears clear now that all primate cone bipolar types have a center/surround organization (Fig. 19) (Dacey et al., 2000; Field et al., 2010). This includes the midget bipolar cells (Fig. 19) (Dacey et al., 200). Where does this antagonistic surround organization come from?

The horizontal cells are thought to contribute to the surround response of bipolar cells in submammalian species and particularly in creatures with good color vision. Horizontal cells have been shown to be color opponent in response in fish and turtles for example (Stell and Lightfoot, 1975; see Kamermans and Spekreijse, 1995 or Kolb and Lipetz, 1991 for reviews). The situation is different in primate retina where color opponency has been difficult to detect in intracellular recordings of monkey horizontal cells (Dacey et al., 1996) despite the anatomical findings on spectrally selective connectivity (Ahnelt and Kolb, 1994; Dacey et al. 1996).
However, it has recently been shown by elegant experiments in macaque monkey that red and green cones receive an antagonistic surround response from horizontal cells, presumably HI cells (Verweij et al., 2003). Similarly, primate (blue) S-cones clearly have an opponent yellow surround that appears to come from horizontal cells driven by L- and M-cones according to Packer and co-authors (2010). Very recent evidence from the same group (Crook et al., 2011) indicates quite definitively that horizontal cell feedback can account for surround opponency to red and green midget ganglion cells in primate retina, showing that the midget bipolar cells are already color opponent in nature. There does not appear to be any inner retina (amacrine cell) input to organize surrounds in midget bipolar cells and midget ganglion cells. The possibility exists that some large field diffuse cone bipolar types that are not spectrally opponent, and have surrounds consistently larger than midget bipolar cells could involve an amacrine cell content (Taylor, 1999; Dacey et al., 2000).

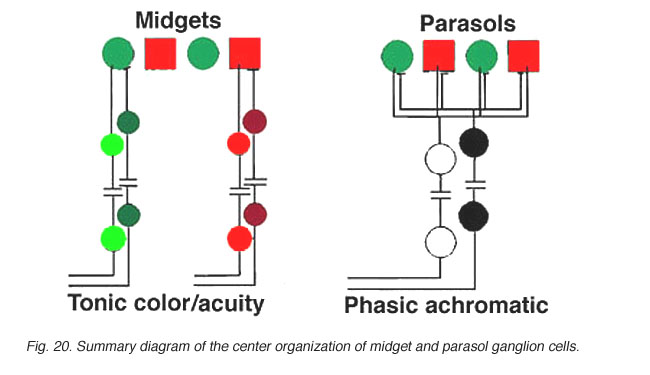
We believe that L- and M-midget ganglion cell responses are organized in the manner shown in Figure 20. An L-cone would contact two L-cone midget bipolars and through them, two L-cone midget ganglion cells. For example, an L-cone ON-center midget bipolar would contact a single L-cone at invaginating synapses in the OPL, and a single L-cone ON-center midget ganglion cell in sublamina b of the IPL. The same L-cone would also be contacted by a single OFF-center midget bipolar at basal junctions, and the bipolar would, in turn, contact a single OFF-center midget ganglion cell in sublamina a of the the IPL (Fig. 20, left). Thus L-cone ON- and L-cone OFF-center receptive field ganglion cell types are generated (red + center and orange – center, Fig. 20, left). M-cones would be connected in a similar manner to two midget bipolars (ON and OFF types) and two midget ganglion cells which would also be ON and OFF-center receptive field types (dark green + center and light green – center, Fig. 20, right).
All of the three types of horizontal cell, HI, HII and HIII could make M-cone surrounds to L-cone center bipolars, and L-cone surrounds to M-cone center bipolar cells. However the HII cell may be more involved with spectrally antagonistic fields in the blue/yellow bipolar cell pathways (see Webvision S-Potentials and Horizontal Cells).
CLICK HERE to see an animation of midget pathways in the human retina (Quicktime movie)
6. M and blue/yellow ganglion cells.
The large field parasol cells of the primate retina are thought to convey achromatic information concerning low spatial acuity, movement and luminance messages (Merigan, 1989; Merigan and Maunsell, 1990). Parasol cells come in ON- and OFF-center varieties like the midget ganglion cells and project to the magnocellular layers of the lateral geniculate nucleus (Fig. 21): hence they are also called M cells (Shapley and Perry, 1986; Kaplan and Shapley, 1986). Parasol ganglion cells also have a surround mechanism to their receptive field physiology, that like the midget ganglion cells is thought to originate mainly in the outer plexiform layer from a horizontal cell feedback mechanism (McMahon et al., (2004). The blue yellow ganglion cells (Fig. 21) are a bistratified type and thought to be driven by blue-specific bipolar cells, and other midget or diffuse types to give them their yellow response (Dacey and Lee, 1994). They project to a special layer of the geniculate nucleus called the koniocellular layer or K layer (Martin et al., 1997; Roy et al., 2009) (Fig. 21). We shall deal with the short wavelength sensitive system in another chapter (Webvision: S-cone pathways) and so will say little more about these ganglion cells here.

7. References.
Ahnelt PK, Kolb H, Pflug R. Identification of a subtype of cone photoreceptor, likely to be blue sensitive, in the human retina. J Comp Neurol.1987;255:18–34. [PubMed]
Ahnelt P, Keri C, Kolb H. Identification of pedicles of putative blue sensitive cones in human and primate retina. J Comp Neurol. 1990;293:39–53.[PubMed]
Ahnelt P, Kolb H. Horizontal cells and cone photoreceptors inhuman retina: a Golgi-electron microscopic study of spectral connectivity. J Comp Neurol.1994;343:406–427. [PubMed]
Boycott BB, Hopkins JM. Cone bipolar cells and cone synapsesin the primate retina. Vis Neurosci. 1991;7:49–60. [PubMed]
Calkins DJ, Schein SJ, Tsukamoto Y, Sterling P. M and L cones in macaque fovea connect to midget ganglion cells by different numbers of excitatory synapses. Nature. 1994;371:70–72. [PubMed]
Calkins DJ, Tsukamoto Y, Sterling P. Microcircuitry and mosaic of a blue-yellow ganglion cell in the primate retina. J Neurosci. 1998;18:3373–3385.[PubMed]
Calkins DJ, Meszler LB, Hendry SHC. Multiple ganglion cell types express the a subunit of type II calmodulin-dependent protein kinase in the primate retina. Soc Neurosci Abstr. 1997;23:729.
Campbell FW, Gubisch RW. Optical quality of the human eye. J Physiol. 1966;186:558–578. [PubMed] [Free Full text in PMC]
Cicerone CM, Nerger JL. The relative numbers of long-wavelength-sensitive to middle-wavelength-sensitive cones in the human fovea centralis. Vision Res.1989;29:115–128. [PubMed]
Dacey DM, Peterson MR. Dendritic field size and morphology of midget and parasol ganglion cells in the human retina. Proc Natl Acad Sci U S A.1992;89:9666–9670. [PubMed] [Free Full text in PMC]
Dacey DM. The mosaic of midget ganglion cells in the human retina. J Neurosci. 1993;13:5334–5355. [PubMed]
Dacey DM, Lee BB. The “blue-on” opponent pathways in primate retina originates from a distinct bistratified ganglion cell. Nature. 1994;367:731–773.[PubMed]
Dacey DM, Lee BB, Stafford DK, Pokorny J, Smith VC. Horizontal cells of the primate retina: cone specificity without spectral opponency. Science.1996;271:656–659. [PubMed]
Dacey DM, Packer OS, Diller L, Brainard D, Peterson B, Lee B. Center surround receptive field structure of cone bipolar cells in primate retina. Vision Res.2000;40:1801–1811. [PubMed]
Drasdo N, Fowler CW. Non-linear projection of the retinal image in a wide-angle schematic eye. Br J Ophthalmol. 1974;58:709–714. [PubMed] [Free Full text in PMC]
Gouras P. Identification of cone mechanisms in monkey ganglion cells. J Physiol. 1968;199:533–547. [PubMed] [Free Full text in PMC]
Gouras P. Precortical physiology of colour vision. In: Gouras P, editor. Vision and visual dysfunction. Vol. 6: The perception of colour. London: Macmillam Press Ltd.; 1991. p. 163-178.
Gouras P. Retinal circuitry and its relevance to diagnostic psychophysics and electrophysiology. Curr Opin Ophthal. 1992;3:803–812.
Irvin GE, Casagrande VA, Norton TT. Center/surround relationships of magnocellular, parvocellular, and koniocellular relay cells in primate lateral geniculate nucleus. Vis Neurosci. 1993;10:363–373. [PubMed]
Kamermans M, Spekreijse H. Spectral behavior of cone-driven horizontal cells in teleost retina. Prog Ret Eye Res. 1995;14:313–360.
Kaplan E, Shapley RM. The primate retina contains two types of ganglion cells, with high and low contrast sensitivity. Proc Natl Acad Sci U S A.1986;83:2755–2757. [PubMed] [Free Full text in PMC]
Kolb H. Organization of the outer plexiform layer of the primate retina: electron microscopy of Golgi-impregnated cells. Philos Trans. R. Soc. B.1970;258:261–283.
Kolb H, DeKorver L. Midget ganglion cells of the parafovea of the human retina: a study by electron microscopy and serial section reconstructions. J Comp Neurol. 1991;303:617–636. [PubMed]
Kolb H, Lipetz LE. (1991). The anatomical basis for colour vision in the vertebrate retina. In: Gouras P, editor. Vision and visual dysfunction. Vol. 6: The perception of colour. London: Macmillan Press Ltd.; 1991. pp. 128-145.
Kolb H, Linberg KA, Fisher SK. The neurons of the human retina: a Golgi study. J Comp Neurol. 1992;318:147–187. [PubMed]
Kolb H, Goede P, Roberts S, McDermott R, Gouras P. The unique morphology of the S-cone pedicle n the human retina and its consequences for color processing. J Comp Neurol. 1997;386:443–460. [PubMed]
Kolb H, Marshak D. The midget pathways of the primate retina. Doc Ophthalmol. 2003;106:67–81. [PubMed]
Merigan WH. Chromatic and achromatic vision of macaques: role of the P pathway. J Neurosci. 1989;9:776–783. [PubMed]
Merigan WH, Maunsell JH. Macaque vision after magnocellular lateral geniculate lesions. Vis Neurosci. 1990;5:347–352. [PubMed]
Mollon JD, Bowmaker JK. The spatial arrangement of cones in the primate fovea. Nature. 1992;360:677–679. [PubMed]
Nelson R, Famiglietti EV, Kolb H. Intracellular staining reveals different levels of stratification for on- and off-center ganglion cells in cat retina. J Neurophysiol. 1978;41:472–483. [PubMed]
Polyak SL. The retina. Chicago: University of Chicago Press. 1941
Rodieck RW, Binmoeller KF, Dineen JT. Parasol and midget ganglion cells of the human retina. J Comp Neurol. 1985;233:115–132. [PubMed]
Roorda A, Williams DR. The arrangement of the three cone classes in the living human eye. Nature. 1999;397:520–522. [PubMed]
Shapley R, Perry VH. Cat and monkey retinal ganglion cells and their visual functional roles. Trends Neurosci. 1986;9:229–235.
Stell WK, Lightfoot DO. Color-specific interconnections of cones and horizontal cells in the retina of the goldfish. J Comp Neurol. 1975;159:473–501.[PubMed]
Wässle H, Boycott BB. Functional architecture of the mammalian retina. Physiol Rev. 1991;71:447–480. [PubMed]
Wiesel TN, Hubel DH. Spatial and chromatic interactions in the lateral geniculate body of the rhesus monkey. J Neurophysiol. 1966;29:1115–1156.[PubMed]
Last Updated: June, 2012.