Matthew Schmolesky
The human visual system can detect and discriminate between an incredibly diverse assortment of stimuli that may be chromatic or achromatic, in motion or not, pattered or unpatterned, two-dimensional or three. Remarkably, the neural end-product of visual stimuli impacting upon the retina is, in one sense, always the same. After the complexities of phototransduction, lateral interactions provided by horizontal and amacrine cells , and integration of signals by ganglion cell dendrites only the constantly changing stream of action potentials propogating along ganglion cell axons is left to inform our visual perception. These seemingly identical signals must somehow be processed in the subcortex and cortex to create the full range of visual percepts we experience. How this is achieved is a puzzle that currently occupies the professional lives of thousands of researchers and the basic framework of a solution has only begun to unfold in the last several decades.
To achieve an understanding of cortical and subcortical processing we can ask two basic questions about the signals leaving the retina:
- What are the discrete anatomical pathways that carry the signal?
- What information do the signals actually carry?
The answers to these questions do not exist. That is, the answers we have so far are incomplete and, in many cases, conflicting. I point this out first because the reader should be aware that vision research is a burgeoning field, where new articles published every week bring additional details about how the brain copes with its monumental task. To complicate matters, the animals most commonly studied to understand visual processing (monkey, cat, ferret, rat, mouse, hamster, zebrafish, goldfish, etc.) do not conveniently carry small, medium, large and extra-large copies of the same brain within their craniums. While evolution has settled upon many visual system designs that are shared by these species, substantial differences also exist. For the purpose of this review I will focus almost entirely upon the macaque monkey visual system for the reason that it is one of the most understood and best models we have for human vision to date. I will begin with a historical perspective on visual system research, and continue by attempting to answer the two basic questions posed above in relation to the primary visual cortex or V1.
Historical Perspective.
The relationship between vision and the eye must have been correctly understood from the earliest times of human existence. Surpassing this most basic understanding, however, required careful dissection of the eye, optical fibers and brain structures of animals and/or humans. One view holds that the religious and social doctrines of the Pre-Classical civilizations (e.g. Egyptians, Sumerians, Assyrians, Babylonians, Hindus, Chinese, Indians, etc.) did not permit such dissections. The more primative herdsman and farmers surrounding the Mediterranean Sea did not have such inhibitions and are believed to have studied basic anatomy, albeit nonsystematically, during sacrificial rituals. These herdsman and farmers evolved a terminology for the anatomical structures they discovered.
Polyak (1957) maintains that this terminology was quickly adopted by the Greeks of 600-400 B.C. when the study of anatomical organization was rigorously pursued. During this time, physicians such as Hippocrates (460-380 B.C.), Alkmaeon (520 B.C.), and Anaxagoras (500 B.C.) carried out dissections of animal and human bodies and brains and held opinions of some accuracy concerning brain function, such as movement, sensation and thinking.
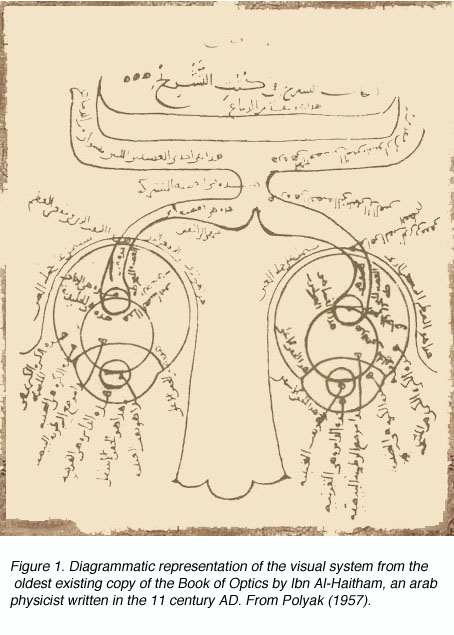
The height of Greek medical scientific knowledge was reached during the Hellenistic or Alexandrian period from 323 to 212 B.C. The most prolific of medical scientists was the “Prince of Physicians” Galen (129-201 A.D.) of Pergamon (present day Turkey). As noted by Polyak (1957), Galen’s contributions to the understanding of human anatomy and physiology under normal and pathological conditions were vast, and provided a foundation for medicine in the Arab period and, subsequently, the Revival in Europe during the late Middle Ages and Modern Times. Figure 1 shows the arab adaptation of Galen¹s ideas on the pathways of the visual sytem from eyes to forebrain.
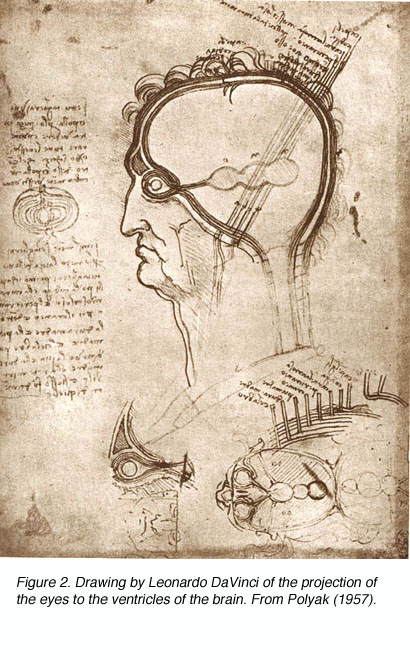
Though Galen accurately described much of the visual system gross anatomy, he did not recognize the decussation of fibers at the optic chiasm, nor did he trace the fibers to the dorsal lateral geniculate nucleus (LGNd) of the thalamus (Fig. 1). Instead, he suggested that they were connected to the lateral ventricles (which he named the “thalami”). This belief was consistent with the prevailing view on nerves in general at the time, namely that they were hollow channels carrying various “spirits” such as the visual spirit. Over one thousand years later, the beliefs of humanist scientists such as Leonardo Da Vinci (who pictorally described the same optic fiber to lateral ventricle pathway) (Fig. 2) and Des Cartes (who promoted the view of nerves carrying animal spirits) echoed Galen’s teachings and demonstrate how little progress had been made in such a long time.
Following the Hellenistic period, the ethics supported during the first several centuries of the Christian Era denied medical practitioners and scientists the right to dissect human corpses. This stricture was expanded in the Dark Ages to include the dissection of animals and, from this point until the 1600s, healers were forced to rely almost entirely upon what little information they could glean from the Classical period.
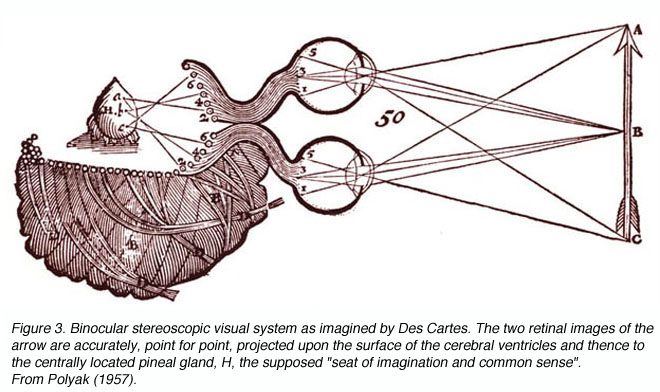
Figure 3. Binocular stereoscopic visual system as imagined by Des Cartes. The two retinal images of the arrow are accurately, point for point, projected upon the surface of the cerebral ventricles and thence to the centrally located pineal gland, H, the supposed ³seat of imagination and common sense². From Polyak (1957)
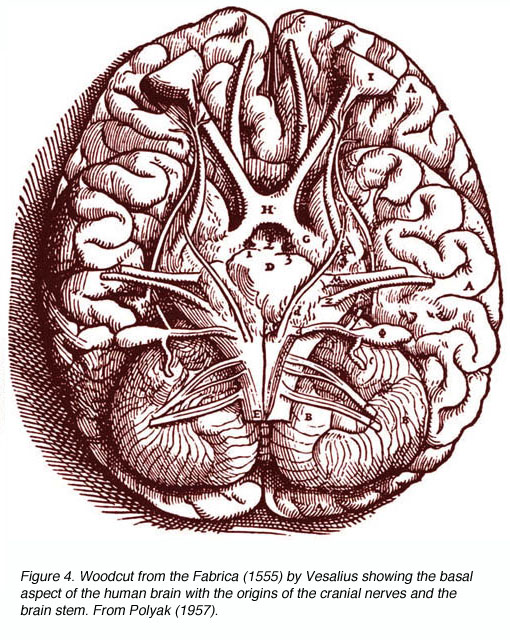
Figure 4. Woodcut from the Fabrica (1555) by Vesalius showing the basal aspect of the human brain with the origins of the cranial nerves and the brain stem. From Polyak (1957)
Between 1600 and 1860 A.D. the most basic understanding of central visual system anatomy and function was obtained. The partial decussation of optical fibers at the chiasm was deduced. The projection of these fibers into the LGNd and the optic radiations to the cortex were described. Accidental and experimentally induced cortical lesions were correlated to symptomologies found in the patients and experimental animals, respectively, leading to the notion of localized cortical function. Cortical dissections were carefully performed and the line of Gennari (the dense myelinated fiber bundle running through V1 layer 4B; named for its discoverer) in the primary visual cortex was described.
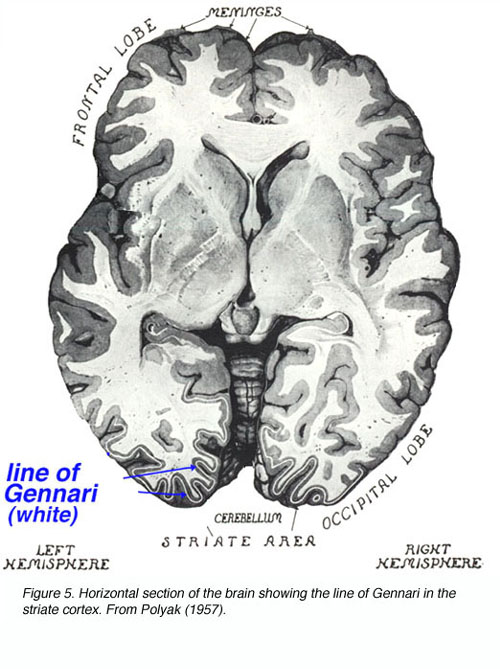
This striation gave rise to the term “striate cortex” to describe V1. Unstained sections of cortex were examined on slides revealing the 6 cortical layers to Baillarger. The notion of retinotopic organization in central structures gained wide acceptance.
In the late 1800s and early 1900s several advances in histological preparation led to a boom in cellular studies of the visual cortex. Better chemical treatments were found for hardening the brain prior to cutting thin slices; gross neuronal and fiber staining dye protocols were developed (e.g. those of Wigert and Nissl); and the Golgi technique for labeling individual cells complete with their extensive axonal and dendritic arborizations was established.
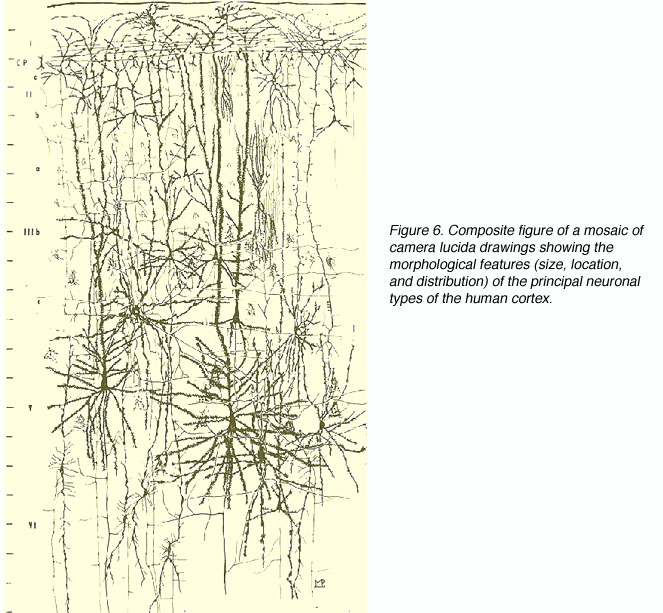
For the first time researchers could view the intricacies of neuronal morphology and the details of laminar differences. No single researcher contributed more in this regard than Santiago Ramón y Cajal (1852-1934). Ramón y Cajal gave a detailed account of the cellular morphologies throughout the cortex (visual and otherwise) using the Golgi method and his own modified silver staining method. The incredible detail afforded by these techniques allowed Ramón y Cajal to suggest certain neural pathways and circuits and theorize on the functional significance of the cortical constituents. The advent of electron microscopy permitted researchers to describe the details of synaptic connections. The development of “tracer” dyes that are taken up by distal fibers and transported towards the cell body (retrograde tracers) or taken up by the cell/dendrites and transported along the fibers to the distal terminals (anterograde tracers) greatly enhanced the search for feedforward and feedback pathways in the visual system (specific transsynaptic degeneration following lesions in nuclei and/or fiber bundles was used previously but with far less success).
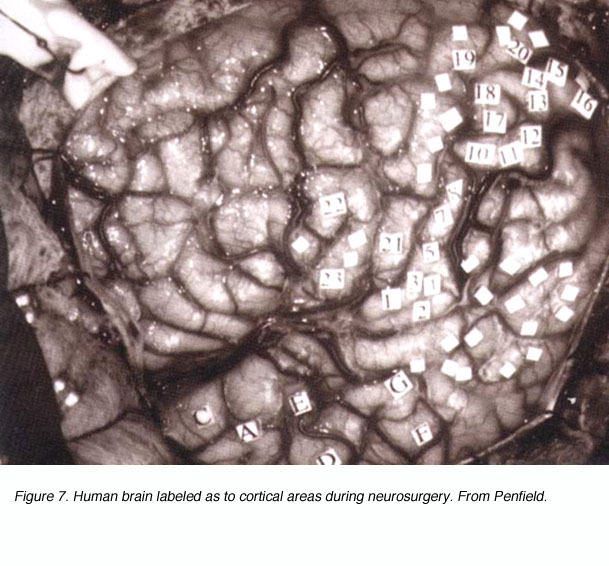
Figure 7. Human brain labeled as to cortical areas during neurosurgery
All of the progress described above is anatomical in nature. What about the function of the visual pathways? How were researchers approaching this issue in the late 1800s and early 1900s? Clinical cases described over the centuries already pointed to the functional specialization of discrete cortical areas. Experimental lesions within the cortex confirmed this notion. Electrical stimulation of the cortex (e.g. Hitzig and Fritsch on dog and monkey motor cortex) provided the coup de grace to the doctrine of functional equivalence and established the theory of functional cerebral localization in its place. Surgeons such as Penfield were mechanically stimulating the brains of conscious patients during operations and recording the sensations evoked (Fig. 7). The critical step in obtaining a functional map of the visual system, however, came when researchers moved from electrical stimulation to electrical recording.
Scalp recordings of visual evoked potentials (VEPs) were used to map visually responsive cortical areas and examine retinotopic organization and binocularity in rabbit, cat and monkey (Talbot and Marshall, 1941; Thompson et al., 1950; Daniel and Whitteridge, 1959). Simultaneously, microelectrodes were being used to study single cells/fibers (or small groups) in the retina/optic tract (e.g. Hartline, 1938; Kuffler, 1953) and somatosensory cortex (Mountcastle, 1957; Powell and Mountcastle, 1959). Hubel and Wiesel first applied the single unit recording technique to the visual cortex of cats (1959, 1962) and monkeys (1968, 1974, 1977) with stunning results. With this incredible series of experiments (for which David Hubel and Torston Wiesel later won the Nobel Prize, 1982) the modern era of visual cortex research was ushered in.
With this historical perspective in mind, we should turn our attention to the current understanding of the primary visual cortex and its place in the visual pathways.
WHICH ANATOMICAL PATHWAYS CARRY THE VISUAL SIGNAL?
Basic Anatomy.
The macaque primary visual cortex, like that of all mammals studied, resides in the posterior pole of the occipital cortex (Fig. 8).
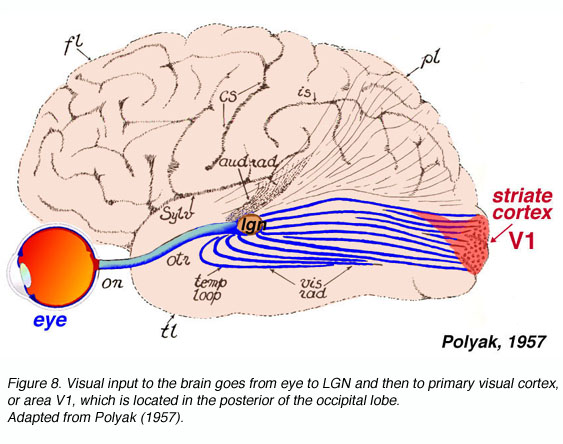
V1 extends rostrally almost to the lunate sulcus and posterolaterally almost to the inferior occipital sulcus; the V1/V2 border is met before either sulci. Much of V1 is found within the calcarine sulci and the limits of V1 within these folds can be marked by the distinct appearance of V1 layer 4 (Fig. 9).
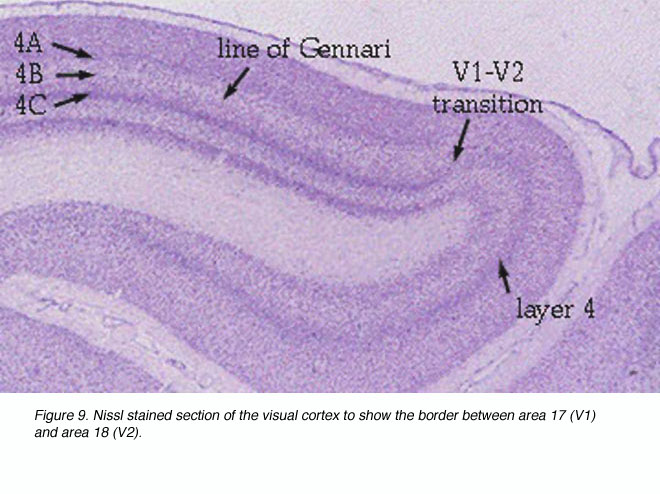
Figure 9. Nissl stained section to show the border between area 17 (V1) and area 18 (V2)
The anatomy of the primate primary visual cortex has been worked out in great detail. The three basic organizing principles of primate V1 are the (1) laminar and (2) columnar arrangement of excitatory and inhibitory neurons (an arrangement shared with other neocortical areas) and (3) the regular spacing of anatomical/functional compartments revealed by cytochrome oxidase (CO) labeling.
Several simple facts and rules of thumb can be stated before addressing the details of these anatomical features:
* The 6 cortical layers introduced by Brodmann (layer 1 most dorsal, layer 6 most ventral) have been subdivided time and again as additional aspects of the neurons and their connections have been revealed
* Layer 1 is nearly aneuronal, composed predominantly of dendritic and axonal connections. In one mm3 of V1 tissue one could expect to find approximately 4,700 neurons, 2,900 microglia, 3, 400 oligodendrocytes and 49,000 astrocytes (O’Kusky and Colonnier, 1984). Of the neurons present over 80% are GABAergic (Fitzpatrick et al., 1987).
* Approximately 20% of the neurons in layers 2-6 are inhibitory interneurons (GABAergic) that make major contributions to the function of V1 circuits but do not project axons outside this area.
* Layers 2/3 (the “supergranular” layers) contain many excitatory projection neurons that send axons to extrastriate cortical regions (e.g. V2, V3, V4, MT, etc.).
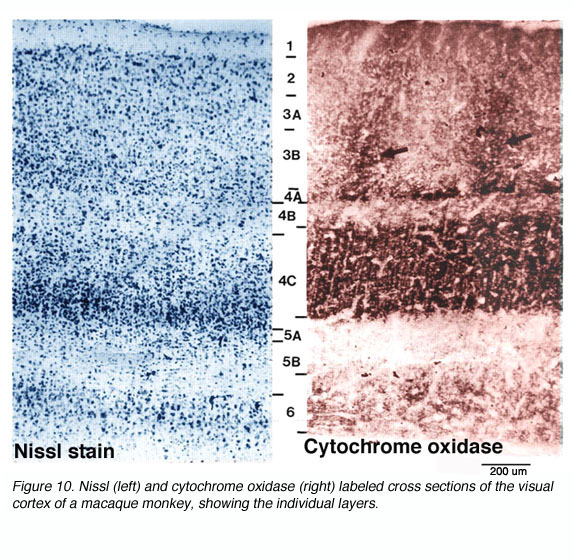
* Layer 4 (the “granular” layer) is divided into 4 horizontal sublayers: 4A, 4B, 4Ca, and 4Cb. Layers 4Ca and 4Cb are the major recipients of LGNd innervation. The LGNd magnocellular (M) and parvocellular (P) layers project to 4Ca and the 4Cb, respectively. Thus, the M and P streams remain segregated at this stage (but see qualification below).
* Layers 5/6 (the “infragranular” layers) contain many excitatory projection neurons that innervate the LGNd to provide feedback to this relay area.
* Labeling of V1 and V2 for CO content has revealed CO rich and poor regions termed “blobs” (or puff, spots, or patches) and “interblobs” in V1 and the thick, thin and pale stripes in V2. The relevance of these compartments is still a matter of some debate.
* CO blobs do not extend uniformly from the surface of layer 1 to the base of layer 6. Instead, they concentrate in layers 3B, 4B, and 4C (Fig 10).
* Projections to and from the CO blobs and interblobs are relatively distinct as follows:
a) Pb (for Primate P or midget ganglion cells) project to the LGNd parvocellular layers (see chapter on midget pathways of the retina) which project to V1 layer 4C and then project to the interblobs of V1 layers 2/3 and finally these layers project to the pale stripes of V2 geniculate
b) The blue-yellow ganglion cells (see chapters on S-cone pathways and color vision) project to the intercalated layers and S/K (K for “koniocellular”) layers of the LGNd which project to the blobs of V1 layers 2/3 which project to the thin stripes of V2
c) Pa (M cells or parasol ganglion cells) project to the LGNd magnocellular layers and thence to layer 4C of V1. This layer projects to the blobs of V1 layers 2/3 and also to layer 4B of V1. Layer 4B, in turn, projects to the mediotemporal area (MT) and to the thick stripes of V2.
* Layers 1 and 2 receive feedback inputs from extrastriate cortex.
* The neuroglia in the young adult macaque V1 account for 20-35% of all cells (not including pericytes). The neuroglia can be divided into oligodendrocytes (~ 7-10% of cells), astrocytes (~ 11-20% of cells), and microglial cells (~ 1.5-3% of cells)(O’Kusky and Colonnier, 1982; Peters et al., 1991).
Neuronal Constituents.
There are three basic types of neurons in the primate V1 (Fig 12):
-
- Spiny pyramidal cells (excitatory)
-
- Spiny stellate cells (excitatory)
- Smooth or sparsely spinous interneurons (almost all are GABAergic).
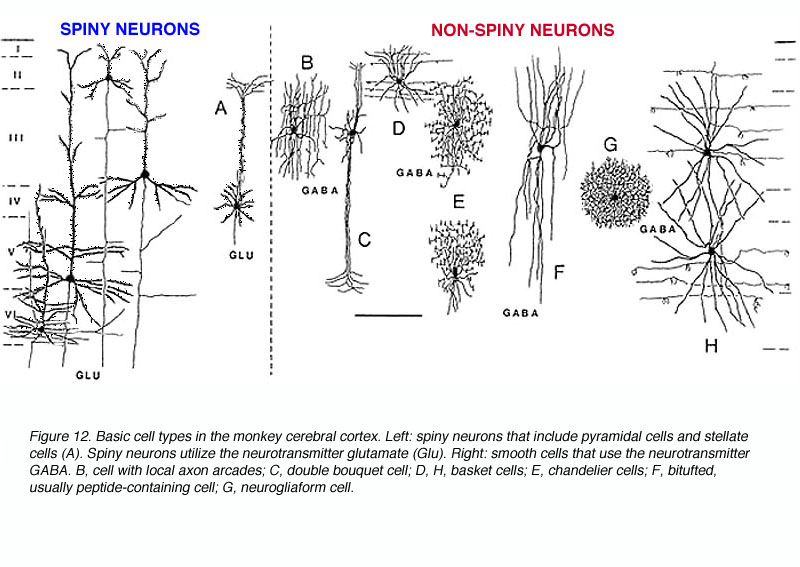
The pyramidal cells, as you might guess, have cell bodies that appear like pyramids, have apical dendrites (that is, extending towards the white matter) and their dendrites are covered with spines. Spiny stellate cells are generally smaller and their cell bodies more resemble a star shape. They also have spiny dendrites (Fig. 12A). The interneurons have more rounded cell bodies and have little or no spines on their dendrites. Over the years anatomists have given more or less descriptive appelations to a number of unique subtypes, which are briefly described below.
- Chandelier cell -inhibitory; axons show characteristic branching into vertical sections resembling candlesticks (Fig. 12E).
- Neurogliaform cells -inhibitory; resembling glial cells but definitively neurons; axon and dendrites branch but remain in the locale of the soma giving rise to a dense spherical region of fibers (Fig. 12G).
- Double bouquet cell -inhibitory; axon collaterals and bitufted dendrites extend vertically in a tight bundle (Fig. 12C) Antibodies to calbindin specifically mark these cells and, using this strategy, researchers have found that these cells are regularly spaced in layer 3, thereby forming yet another columnar unit. There are approximately 7-15 double bouquet cells per 10,000 mm2 (DeFelipe et al., 1990).
- Basket cells (Somogyi et al, 1983; DeFelipe et al., 1986) – inhibitory; relatively large cell bodies extend myelinated axonal branch laterally for a great distance. The axonal branches terminate on pyramidal cell bodies and dendrites in a manner resembling a basket. Dendrites extend vertically (Fig. 12D,H).
- Cajal-Retzius cells – inhibitory; Cajal and Retzius found this cell type independently in layer 1 of neonatal animals and humans, respectively. They may or may not exist in the adult.
- Meynert cell – excitatory; large pyramidal cell first described by Meynert; the “outer” Meynert cell bodies are found in 4B and are regularly distributed relative to pyramidal cell cones (Peters and Sethares, 1991; see below). These cells project to area MT. The “inner” Meynert cell bodies are regularly spaced at the layer 5/6 border, lying below CO interblobs. These cells are also found in layer 6. These cells typically have asymmetric, lateral dendritic arborizations, are highly direction selective, and are also known to project to area MT.
The cell types described above represent only a few of the more unique varieties. Jennifer Lund and colleagues (Lund, 1987; Lund et al., 1988; Lund and Yoshioka, 1991; Lund and Wu, 1997) have rigorously studied the presumptive interneurons of the macaque V1 using the Golgi impregnation staining method. Based on a range of morphological criteria (the laminar position of somata, axonal arborization, dendritic arborization, pattern and extent of branching) they have described over 40 types of interneurons alone.
Additional low-density interneurons might remain unidentified. The classes that have been described might be further divided based on chemical content and/or physiological response properties (Fig 12). Alternatively, it should be noted that many of the anatomically distinct types may be physiologically indistinguishable from one another.
The Cortical Layers.
Many numbering schemes exist for the neocortical layers in general and the layers of V1 in particular. I have adopted the basic scheme of Brodmann, who defined the cortical layers based on careful histology. I have also adopted the refinements suggested by the work of Lund and colleagues (see below).
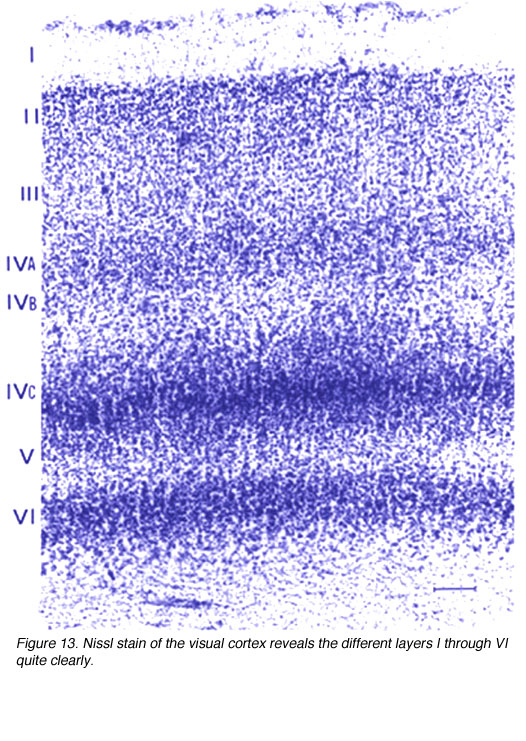
Figure 13. Nissl stain of the visual cortex reveals the different layers quite clearly
Layer 1 is composed of a dense network of synapses formed between the apical dendrites of layer 2-5B pyramidal cells (Lund and Wu, 1997) and the collected inputs from LGNd K layers (Fitzpatrick et al., 1983; Lachica and Casagrande, 1992), the pulvinar, feedback pathways from extrastriate areas, nonspecific thalamic nuclei, and other subcortical regions. Thus, while layer 1 contains few neurons, it is a networking layer that has a direct concerted affect on the firing properties of pyramidal cells in deeper layers.
The supragranular layers (2, 3A and 3B) contain many somata and dendrites of pyramidal cells. Layers 2 and 3A receive little thalamic inputs (the K layer projection to V1 blobs is focused mainly in 3B). They do not receive direct inputs from layer 4C, in contrast to layer 3B that receives a massive 4C input. Layers 2 and 3A do contain many axons and dendrites of neurons found in all other cortical layers.
Layer 4A shows up in the Nissl stain as a dark band of small granule-like cells. This and the lack of pyramidal cells sets this layer apart from layer 3B.
Layer 4B is a cell poor layer that contains a low density arrangement of pyramidal cells the large outer Meynert cells. This layer receives a strong input from the underlying 4Ca and the Meynert cells are known to project directly to area MT as well as the superior colliculus (SC; Fries and Distel, 1983). Cells in layer 4B also project to the thick CO stripes of V2 which in turn project to MT. Thus, this layer plays a substantial role in conveying information in the M pathway/dorsal stream.
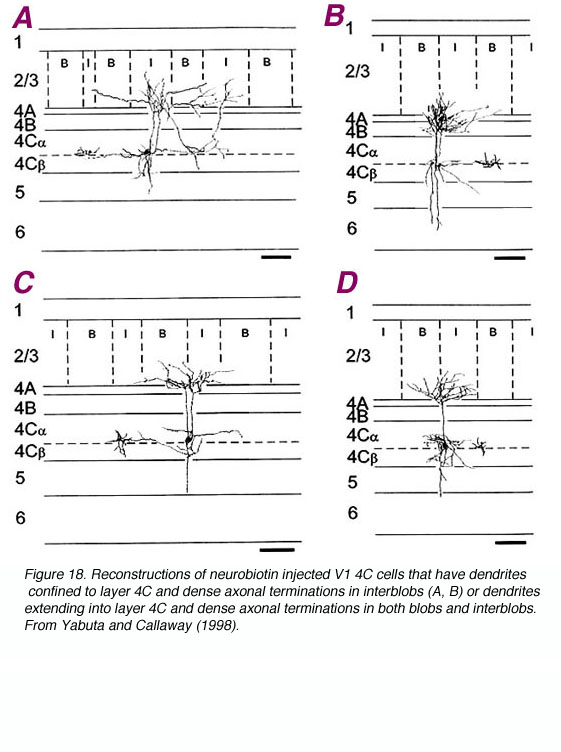
Layer 4C is distinguished from 4B in part due to the great density of stellate cell packing in this layer. Polyak (1957) divided 4Cinto the a and b divisions based solely on histology; upper 4C neurons are more dispersed. Differences in geniculate innervation patterns (i.e. the M layers of LGNd to 4Ca and the P layers to 4Cb; Hubel and Wiesel, 1972; Blasdel and Lund, 1983), the projection patterns of the 4C cells (Lund, 1973) and physiological properties (Blasdel and Fitzpatrick, 1984) have overwhelmingly supported this division. Additional evidence has suggested that the upper and lower divisions of 4Ca may be distinct as well (Blasdel and Lund, 1983; Lund, 1987; Yabuta and Callaway, 1998).
4Cb
Spiny stellate neurons provide a dense innervation of layers 4A and 3B, and sparse innervation in 4C, 5 and maybe 6 (Lund, 1973). No direct projections from 4Cb to 3A, 4B, or 5B have been found (Lund, 1987). In contrast, as already noted, 4Ca projects heavily to 4B.
Local layer 5A neurons do not project to 4B and only weakly innervate 4Cb. They innervate all other layers. 5A neurons appear to project primarily to 3B and 1(Lund, 1987). Pyramidal neurons in 5B send recurrent axons to layer 3A (Lund and Boothe, 1975). Meynert cells at the 5/6 border and within layer 6 project to both MT and SC (Fries et al., 1985).
Layer 6: It is known that neurons in layer 6 send recurrent axons into 4Cb (Lund and Boothe, 1975). Other neurons (or possibly even the same ones) project axons back to the LGNd (Lund et al., 1975). Layer 6 also receives a direct input from the LGNd (Hendrickson et al., 1978), thereby forming a neural loop.
V1 Cortical Columns.
The term “cortical column” refers to the notion that cells arranged vertically from the surface of the cortex to the white matter might comprise functional or anatomical units. Thus, a cortical column can be defined on the basis of anatomical features (e.g. stereotyped patterns of pyramidal cell apical dendrite bundles), functional features (e.g. columns of cortical cells all responding to the same stimulus orientation) or both.
Many types of columns have been proposed including ocular dominance, orientation, spatial frequency, and color columns. The details of these columnar arrangements will be described in later sections dealing with the physiology of V1. However, I will here briefly describe the ocular dominance columns in order to provide an example of columnar arrangement in the primary visual cortex.
Ocular Dominance Columns.
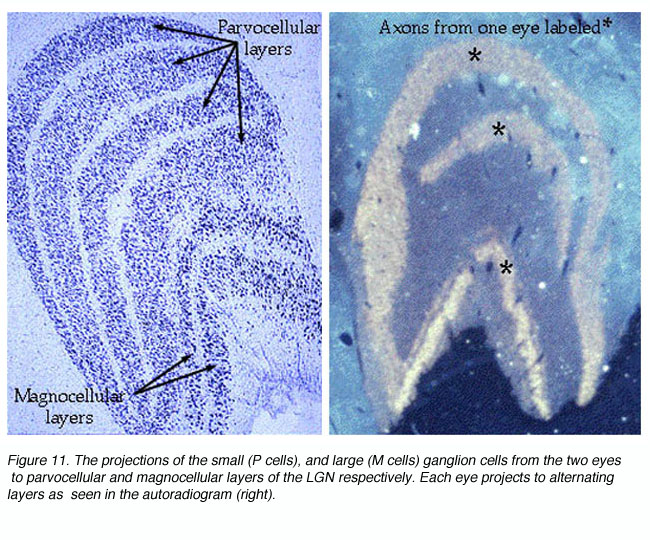
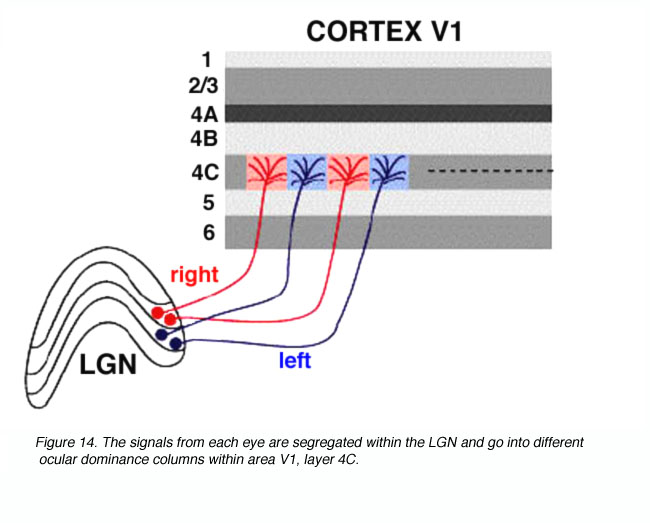
Visual signals from the two eyes remain segregated in the LGNd (Figure 11) and in the geniculorecipient layers of area V1 (Figure 14). One can observe this segregation by measuring the electrophysiological responses of the units in layer 4C. As the recording electrode is moved within layer 4C, there is an abrupt shift as to which eye drives the unit. In layer 4C, the shift from one eye to the other takes place over a distance of less than 50 microns. Signals from these bands converge on individual neurons in the superficial layers of the cortex, thereby forming columns dominated by one eye or the other in an alternating fashion.
Cytochrome Oxidase Labeling.
Cytochrome oxidase (CO) is an integral transmembrane protein that is found in the inner mitochondrial membrane. Because it acts to catalyze the generation of adenosine tri phosphate (ATP), which is itself an energy molecule used in an enormous range of cellular processes, the amount of CO in a cell or nucleus can be used as an indicator of cellular activity. In 1978 Margaret Wong-Riley discovered that, quite apart from its use as an activity indicator, CO labeling in the primary visual cortex reveals a striking array of CO-rich and deficient regions (i.e. blobs and interblobs) (Fig. 16).
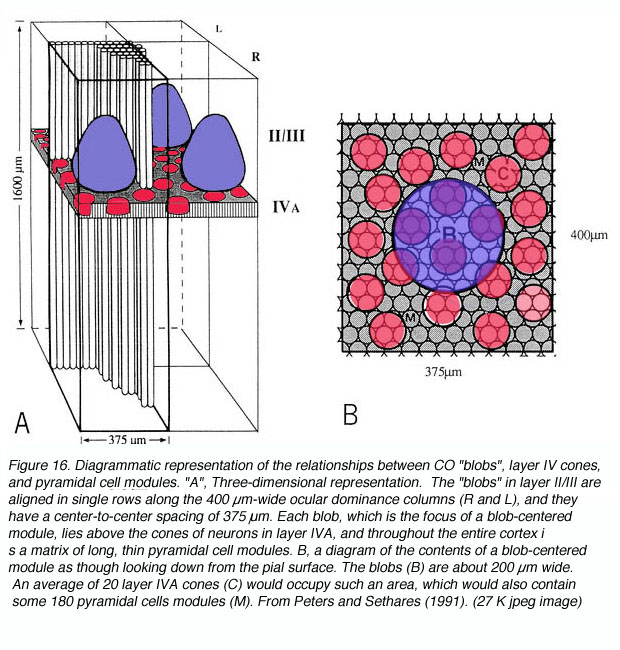
Presumably this regions reflect stable differences in energy consumption in two populations of neurons that were previously undistinguished. Assuming this were true, what other differences might exist between blobs and interblobs? First off, it should be noted that dense CO staining does not exist throughout the entire cortical depth. Instead, CO blobs are most visible in layers 3B, 4A and 4C. Be that as it may, if these dense regions were in fact different from their CO-deficient neighbors in some way, the cells directly above and below rich and poor regions might also show differences in connectivity and functional characteristics correlating with the cells above and below them.
For instance, blobs in layer 3B have been shown to correspond to specific geniculate innervation in macaques (Livingstone and Hubel, 1982; Hendry and Yoshioka, 1994). Boyd and Casagrande (1999) recently found that V1 cells projecting to MT in bush babies and owl monkeys were more numerous below the CO blobs of layer 3B than below the interblobs. Similar data in macaque monkeys also shows clustering of MT projecting cells in periodical steps through the lateral extent of V1 (Shipp and Zeki, 1989) but did not find a correlation between these clusters and the CO.
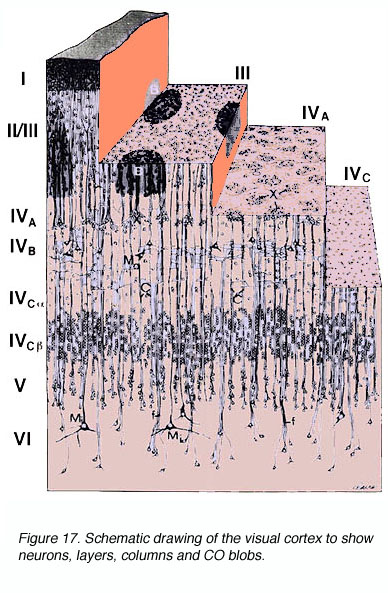
Figure 17. Schematic drawing of the visual cortex to show neurons, layers, columns and CO blobs
Feedforward and Feedback Pathways.
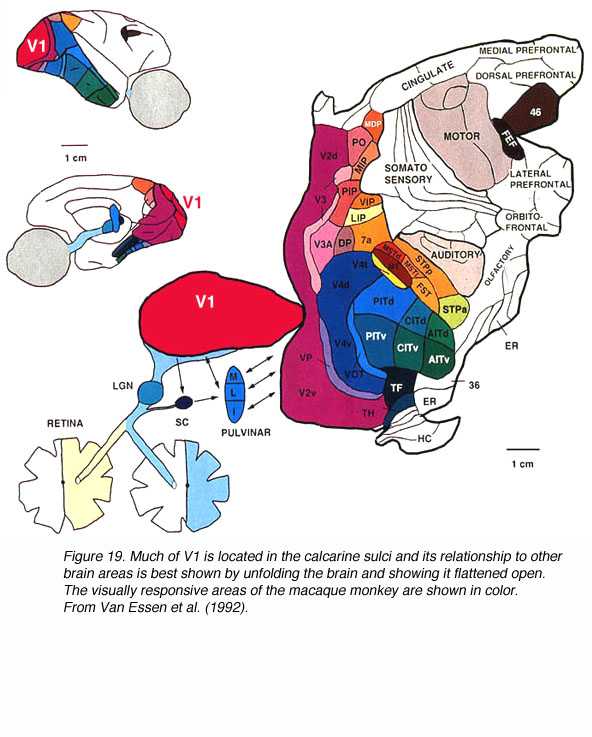
The signals from the two retinas are communicated to area V1 via the LGN. In the macaque monkey, after the signals are processed in V1 they are communicated via multiple pathways to the 30+ visually responsive extrastriate cortical areas (Fig. 19).
Anatomical hierarchical models place the visual cortical areas into a multi-level processing model based upon the pattern of feedforward, lateral, and feedback pathways found in each area. In general, feedforward pathways are considered to be those that project from the supragranular layers of one area and terminate in layer 4 of the target area. In contrast, feedback projections are those that arise from the infragranular layers of one area and terminate outside of layer 4 in the target area (see Felleman and Van Essen, 1991; Hilgetag et al., 1996; Barone et al., 2000).
In the previous sections I have described the anatomical borders of V1, the cells that exist in this area, the arrangement of those cells in layers, columns, and CO compartments and I have hinted at the visual pathways that course into and out of V1. It is true that visual information is passed from the retina to the LGNd to V1 to the higher cortical areas and that the higher areas project back to V1 and V1 to the LGNd (there are no efferent projections to the primate retina). However, while this view of visual processing is accurate it does not capture the wealth of upstream and downstream connections found in V1.
Direct feedforward projections to V1 originate from the pulvinar, LGNd, claustrum, nucleus paracentralis, raphe system, locus coeruleus, and the nucleus basalis of Meynert (Ogren and Hendrickson, 1976; Rezak and Benevento, 1979; Graham, 1982; Blasdel and Lund, 1983; Doty, 1983; Perkel et al., 1986; Lachica and Casagrande, 1992; Hendry and Yoshioka, 1994; Adams et al., 2000).
Direct feedforward projections from V1 extend to V2, V3, V5 or MT, MST, and FEF (Lund et al., 1975; Maunsell and Van Essen, 1983; Ungerleider and Desimone 1986a,b; Livingstone and Hubel, 1987; Shipp and Zeki, 1989; Boussaoud et al., 1990; Fitzpatrick et al., 1994).
Direct feedback projections to V1 originate from V2, V3, V4, V5 or MT, MST, FEF, LIP and inferotemporal cortex (Ungerleider and Desimone, 1986a,b; Perkel et al., 1986; Shipp and Zeki, 1989; Rockland et al., 1994; Barone et al., 2000; Suzuki et al, 2000.
Direct feedback projections from V1 extend to SC, LGNd, pulvinar, and pons (Fries and Distel, 1983; Lund et al., 1975; Graham, 1982; Fries, 1990; Gutierrez and Cusick; 1997).
The connections listed above represent only a subset of the direct and indirect projections that carry signals into and out of the primary visual cortex and do not even begin to describe the extensive lateral connections within V1 itself.
WHAT INFORMATION DOES THE VISUAL SIGNAL CARRY?
We now know the arrangement of neurons, dendrites and axons in the layers, columns and CO compartments of V1. We know many of the pathways extending into and out of V1 involving the retina, subcortex and extrastriate cortex. We can imagine light impinging upon the eye and, from this origin point, a cascade of action potentials streaming from neuron to neuron, area to area, forwards, lateral and back again. In the abstract we know that it is these signals that are responsible for our vision of the external world. But how do these millions of patterned spikes resolve themselves into an actual percept? A partial answer is to consider that every image can itself be broken down into components (e.g. lines, colors, textures, shades, and motion, etc.) and that visual cortical neurons are specialized to detect only a subset of these components.
Receptive Field Properties.
Each cell in the visual cortex has a receptive field, a discrete area in space relative to the fovea where the presentation or removal of a visual stimulus will cause cellular activation. By definition, stimuli presented outside of this receptive field will neither increase nor decrease the ongoing activity of that individual cell. The location and size of a receptive field (RF) can be considered among the most basic of RF properties
Retinotopic maps in V1.
The spatial position of the ganglion cells within the retina is preserved by the spatial organisation of the neurons within the LGN layers. The posterior LGN contains neurons whose receptive field are near the fovea. Progressing from posterior to anterior, the receptive field locations become increasingly peripheral in the retina (see Erwin et al., 1999). This spatial layout is called retinotopic organization because the topological organization of the receptive fields in the LGN parallels the organization of the retina.
The signals in area V1 are also retinotopically arranged. From electrophysiology in monkeys, one can measure the location of receptive fields with an electrode that penetrates tangentially through layer 4C, transversing through the ocular dominance columns. The receptive field centers of neurons along this path correspond systematically to locations from the fovea to the periphery. This trend in interrupted locally by small, abrupt jumps at the ocular dominance borders. Thus the striate cortex retains the retinotopic map of the contralateral visual field that is developed in the LGN.
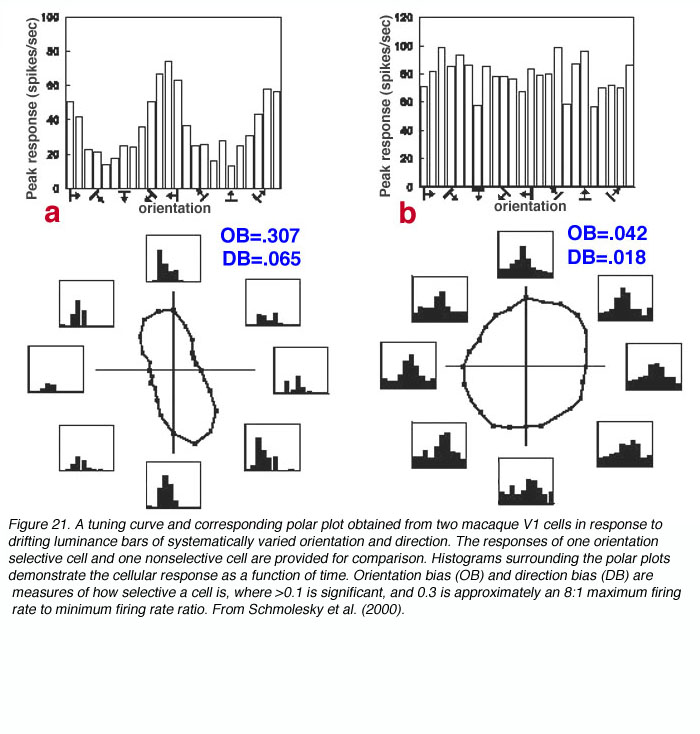
Orientation and Direction Selectivity.
V1 is the first site where strong orientation and direction selectivities are observed in the macaque monkey (Hubel and Wiesel, 1968). While the vast majority of V1 cells show some degree of orientation selectivity, only approximately 25-35% of V1 cells are strongly directionally selective (Schiller et. al., 1976; DeValois et al., 1982). The classic method for testing orientation and direction selectivity is to measure the spike rate of a single cell in response to drifting oriented luminance bars and/or drifting luminance spots (see Figure 21).
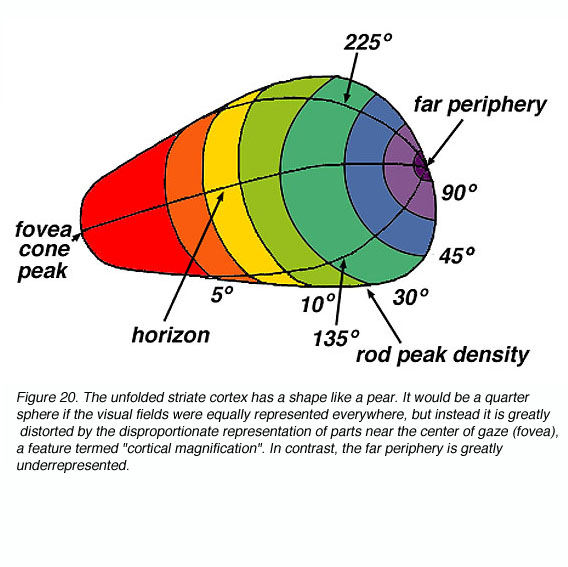
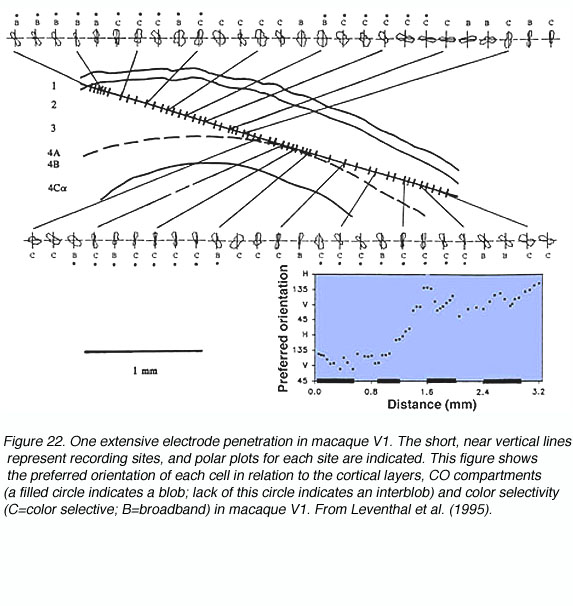
The concept of an orientation column can be easily appreciated by examining figures 20 and 21. When an electrode is lowered into V1 at an angle relatively parallel to the cortical layers (see Fig. 22) the orientation selectivities of the cells encountered vary systematically, where adjacent cellular regions share approximate orientation preferences.
Such recordings led Hubel and Wiesel to propose models of functional organization like the one shown below (Figure 23).

Recently, the orientation columns of V1 first described by Hubel and Wiesel have also been recast into more complex geometries such as partial columns (“slabs”) and pinwheels as dictated by the increasing volumes of evidence (e.g. Bonhoeffer and Grinvald, 1991).
Binocularity and Binocular Disparity.
Hubel and Wiesel (1962) first demonstrated the presence of cells in primate V1 that responded preferentially to visual stimulation in both eyes as opposed to one eye alone. They classified cells using a 7-point scale where 1 = cells excited by the contralateral eye alone, 2 = cells with a strong bias for contralateral stimulation, 3 = cells with a weak bias for contralateral stimulation, 4 = cells that responded maximally to stimulation in both eyes, 5 = cells with a weak bias for ipsilateral stimulation, 6 = cells with a strong bias for ipsilateral stimulation and 7 = cells excited by the ipsilateral eye alone. The proportion of monocular cells (1, 2, 6, and 7) versus binocular cells (3, 4, and 5) was found to vary with the layer in which cells were recorded. Cells in the retinogeniculato-recipient layers 4Ca, and 4Cb were found to be exclusively monocular. Anatomical studies have since shown that these cells receive monocular inputs from the LGNd that do not converge from the alternating layers (Hubel and Wiesel, 1972; Lund and Boothe, 1975).
What might be the usefullness of binocular cells? When an observer fixates on a visual object the image of this object is positioned on corresponding regions of the two retinae. At the same time, however, objects in front of and behind the fixation point create images that lie on non-corresponding regions of the two retinae. The degree to which the images are non-corresponding (as measured by difference scores in retinal eccentricity for instance) is defined as binocular disparity. The ability to use binocular disparity to determine the distance of an object from oneself, and its relation to the fixation plane, is called stereopsis.
Hubel and Wiesel first described the presence of neurons in V1 that are sensitive to binocular disparity. That is, some neurons may show maximal firing rates when a stimulus has positive disparity and weak or even inhibited (below baseline) firing rates to 0 disparity stimuli (in the fixation plane) or negative disparity stimuli. These cells would be described as disparity sensitive, and negative disparity tuned. If the tuning were reasonably sharp, the cell might be described as negative disparity selective, i.e. it responds soley, not simply preferentially, to negative disparity. We now know the % of disparity sensitive cells and the proportion of positive, negative and 0-disparity tuned cells. Clearly there are no disparity tuned cells in layers 4Ca, and 4Cb since binocularity is a prerequisite for disparity sensitivity. As Livingstone and Tsao (1998) note, it is safe to assume that negative and positive disparity selective cells are involved in stereopsis. Of the 0 disparity tuned cells, all may be involved in stereopsis or, alternatively, perhaps only those with very narrow tuning (i.e. selective ones) contribute to this perceptual ability. The work of DeAngelis, Newsome, and Cumming (DeAngelis et al., 1998; DeAngelis and Newsome, 1999) elegantly addresses this issue by attempting to alter stereopsis in trained monkeys by microstimulating subregions of disparity-tuned cells in area MT.
Response Timing in the Visual Pathways.
Another feature of visually evoked single cell response that is currently gaining attention is timing. The order in which visual areas become active and the range of activation times within any given area are important issues. As described above, a prevailing model of primate vision proposes hierarchical stages of visual areas based on anatomical connectivity (Felleman and Van Essen, 1991; Van Essen et. al., 1992; DeYoe et al., 1994; Barone et al., 2000). There is no doubt that a single stimulus initiates a characteristic flow of neuronal discharge from the retina to the LGNd to V1 in a hierarchical manner. Unfortunately, the complexity of corticocortical connections and functional differentiation in primate visual streams renders further predictions highly speculative (see Hilgetag et al., 1996).
We could hypothesize, for instance, that the heavily myelinated path from V1 to mediotemporal area (MT) would lead to fast activation of this area. However, would all MT cells be activated in this manner, or would others wait for activation via the more indirect V1 to V2 to MT route? Many studies have reported response onset latencies from a single visual area. Using these data to construct a chart of activation times across the visual system, however, reveals a host of complications (Nowak and Bullier, 1998).
To begin with, the vast majority of studies that report latencies do so for only one or two visual areas. An activation analysis in 10 visual areas, therefore, might involve cross-comparisons between 5-10 separate studies. In one such comparison we might conclude that, on average, V1 cells become active long before cells in the frontal eye field area (FEF) (Maunsell and Gibson, 1992; Thompson et al., 1996). In another such comparison we would be forced to conclude the opposite (Nowak et al., 1995; for review see Nowak and Bullier, 1998).
The cause for this seeming discrepancy, and many others like it, is undoubtedly the use of different experimental and data analysis protocols. The visual stimuli used (flashing vs. moving; spot, bar, grating, or otherwise; low vs. high luminance or contrast, etc.), animal preparation employed (anaesthetised or not), and data analysis strategy taken for marking latencies (qualitative or quantitative, etc.) all vary across the existing reports.
Consequently, in a recent study we sought to remove these confounds by obtaining onset latencies from many primate visual areas using the same experimental and analytical techniques (Schmolesky et al., 1998). The results demonstrated that the two major functional streams in the primate visual system (the M/dorsal stream involved in motion perception and tracking and the P/ventral stream involved in object recognition and color coding) respond with very different time courses (see Figure 24).
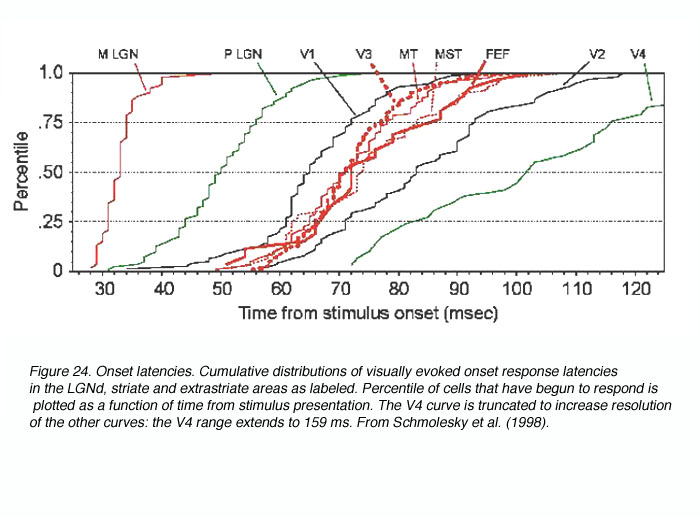
In general, M stream areas respond rapidly and concurrently while their P stream counterparts respond slowly and sequentially. Particularly relevant to this review, the LGNd M cells become active 15-20 msec faster than do their P cell counterparts (Schmolesky et al., 1998; Maunsell et al., 1999) and this temporal separation is maintained in the geniculorecipient layers 4Ca, and 4Cb( (Maunsell and Gibson, 1992; Nowak et al., 1995; Schmolesky et al., 1998). Thus, a functional separation in response timing exists in the M and P pathways of the subcortex and V1 and appears to be conveyed to the dorsal and ventral streams of the extrastriate cortex.
Illusory Contour Perception.
The modern view of visual perception is one of dynamic processes that go beyond the simple replication of visual information provided to the retina. For over 80 years Gestalt psychologists have argued that the act of perception creates a Gestalt, a figure or form that is not a property of an object observed but represents the organization of sensations by the brain (Kandel, 1991, p441]. This dynamism is thought to be crucial for the performance of simple, everyday visual tasks such as the recognition of an object that is partially occluded. Thus, the study of how the brain is capable of filling in the missing pieces is an important topic; one that has most often been carried out through the use of ³illusory contours² (Fig. 25).
Illusory contours (ICs) are defined by their subjective appearance in the absensce of any luminance differences in the image itself. A classic example of an IC is the illusory square, where four sectored discs oriented in an appropriate manner generate the percept of a square. In this instance it is clear that no true luminance differences exist to form a complete square and yet a square is perceived (Fig. 25).
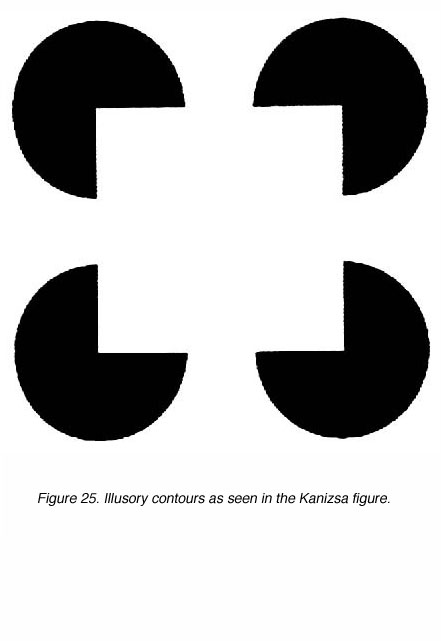
Figure 25. Illusory contours as seen in the illusory square
Behavioural tests indicate that cats and monkeys are capable of perceiving such contours (Bravo et al., 1988; De Weerd et al., 1990, 1996). Recent physiological studies have examined whether single cells in striate and extrastriate cortex respond similarly to conventional luminance contours and those defined by illusions (e.g., Grosof et al., 1993; Peterhans and Von der Heydt, 1989; Von der Heydt et al., 1984; Von der Heydt and Peterhans, 1989). In each of these studies, IC responsive cells were reported. However, these studies provide conflicting evidence about the origin of IC-responsivity, arguing for or against the presence of IC responding cells in V1. The use of alternative ICs in the different studies confuses this issue further.
We sought to approach illusory contour perception from the broader issue of contour perception in general (Leventhal et al., 1998). The issue here is how the brain encodes a stimulus boundary (e.g., a square) when the visual cue that defines that boundary (e.g., color, luminance, texture, motion, illusion, etc.) is varied. As Gestalt psychologists would note, the stimulus is very different in each of these cases but the fundamental percept, the square, remains the same. We asked two fundamental questions. First, are there V1 or V2 cells in cat and monkey capable of responding in a similar fashion to a boundary regardless of the cue defining it? Alternatives to this include the origin of cue-invariance at later stages of visual processing or the separate channeling of cue information via different sub-populations of cells, each responsible for one cue. Second, if such cells exist are they equally prevalent in V1 and V2? Our results demonstrated that a subpopulation of cells in both regions can respond to a stimulus boundary, such as an oriented bar, in a cue-invariant manner, though this property was rare in V1 while prevalent in V2.
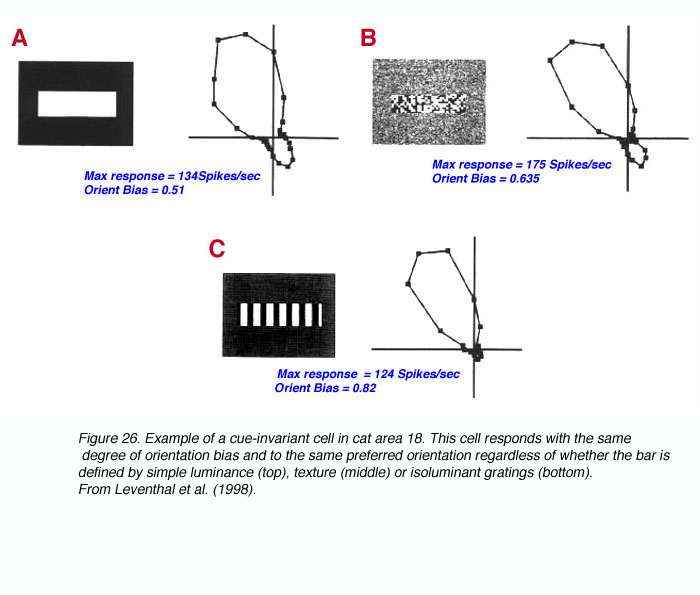
One conclusion from this work is that cells in the very first stage of cortical processing are already capable of responding to a single stimulus boundary in a complex manner that allows for object detection even as the cues defining the object change, or are partially occluded (Leventhal et al., 1998).
Understanding Vision: A Problem of Reverse Engineering.
Our attempt to understand the visual pathways is very much like approaching a machine about which we know nothing but its basic functions. By way of analogy, we all know how to operate a car (more or less) and recognize its basic function, to get us from one place to another. Now let us assume that we knew absolutely nothing but this and, for some reason, decided we should learn every detail of the cars inner workings. We might start by trying to figure out the parts of the car devoted to this central function and those that are not. We remove the bumper, horn, AC, and windshields and find the car still runs splendidly. We remove small parts of the engine, piece by piece until the car no longer starts, analogous to the lesion studies in the brain. Slowly we begin to understand what parts of the car (brain) are involved in locomotion (vision). In vision research we are very much at this stage of the game, still wanting to know what each part actually does, when it does it, and how all the individual parts act in concert. It is the hope of many researchers, myself included, that a careful investigation into the structure and function of the visual pathways using chemical, electrophysiological, genetic, and behavioural approaches will culminate in a true understanding of how the brain provides us with this most crucial of sensory capabilities, vision.
Figure 27. Reverse engineering: the brain studying the brain
References.
Adams MM, Hof PR, Gattass R, Webster MJ, Ungerleider LG. Visual cortical projections and chemoarchitecture of macaque monkey pulvinar. J Comp Neurol.2000;419:377–393. [PubMed]
Barone P, Batardiere A, Knoblauch K, Kennedy H. Laminar distribution of neurons in extrastriate areas projecting to visual areas V1 and V4 correlates with the hierarchical rank and indicates the operation of a distance rule. J Neurosci. 2000;20:3263–3281. [PubMed]
Blasdel GG, Lund JS. Termination of afferent axons in macaque striate cortex. J Neurosci. 1983;3:1389–1413. [PubMed]
Blasdel GG, Fitzpatrick D. Physiological organization of layer 4 in the macaque striate cortex. J Neurosci. 1984;4:880–895. [PubMed]
Bonhoeffer T, Grinvald A. Iso-orientation domains in cat visual cortex are arranged in pinwheel-like patterns. Nature. 1991;353:429–431. [PubMed]
Boussaoud D, Ungerleider LG, Desimone R. Pathways for motion analysis: cortical connections of the medial superior temporal and fundus of the superior temporal visual areas in the macaque. J Comp Neurol. 1990;296:462–495. [PubMed]
Boyd JD, Casagrande VA. Relationships between cytochrome oxidase (CO) blobs in primary visual cortex (V1) and the distribution of neurons projecting to the middle temporal area (MT). J Comp Neurol. 1999;409:573–591. [PubMed]
Bravo M, Blake R, Morrison S. Cats see subjective contours. Vision Res. 1988;28:861–865. [PubMed]
Cajal SR. La retine des vertebres. In: Thorpe SA, Glickstein M, translators. The structure of the retina. Springfield (IL): Charles C. Thomas Publisher; 1933.
Carl Weigert (1845-1904). JAMA. 1964;189:769–770. [PubMed]
Daniel PM, Whitteridge D. The representation of the visual field on the calcarine cortex in baboons and monkeys. J Physiol. 1959;148:33P.
DeAngelis GC, Cumming BG, Newsome WT. Cortical area MT and the perception of stereoscopic depth. Nature. 1998;394:677–680. [PubMed]
DeAngelis GC, Newsome WT. Organization of disparity-selective neurons in macaque area MT. J Neurosci. 1999;19:1398–1415. [PubMed]
DeFelipe J, Hendry SHC, Hashikawa T, Molinari M, Jones EG. A microcolumnar structure of monkey cerebral cortex revealed by immunocytochemical studies of double bouquet cell axons. Neuroscience. 1990;37:655–673. [PubMed]
DeFelipe J, Hendry SH, Jones EG. A correlative electron microscopic study of basket cells and large GABAergic neurons in the monkey sensory-motor cortex.Neuroscience. 1986;17:991–1009. [PubMed]
De Valois RL, Yund EW, Hepler N. The orientation and direction selectivity of cells in the macaque visual cortex. Vision Res. 1982;22:531–544. [PubMed]
De Weerd P, Vandenbussche E, De Bruyn B, Orban GA. Illusory contour orientation discrimination in the cat. Behav Brain Res. 1990;39:1–17. [PubMed]
De Weerd P, Desimone R, Ungerleider LG. Cue-dependent deficits in grating orientation discrimination after V4 lesions in macaques. Vis Neurosci. 1996;13:529–538. [PubMed]
DeYoe EA, Felleman DJ, Van Essen DC, McClendon E. Multiple processing streams in occipitotemporal visual cortex. Nature. 1994;371:151–154. [PubMed]
Doty RW. Nongeniculate afferents to striate cortex in macaques. J Comp Neurol. 1983;218:159–173. [PubMed]
Erwin E, Baker FH, Busen WF, Malpeli JG. Relationship between laminar topology and retinotopy in the rhesus lateral geniculate nucleus: results from a functional atlas. J Comp Neurol. 1999;407:92–102. [PubMed]
Essen DC, Van Anderson CH, Felleman DJ. Information processing in the primate visual system: an integrated systems perspective. Science. 1992;255:419–423.[PubMed]
Felleman DJ, Van Essen DC. Distributed hierarchical processing in the primate cerebral cortex. Cereb Cortex. 1991;1:1–47. [PubMed]
Fitzpatrick D, Itoh K, Diamond IT. The laminar organization of the lateral geniculate body and the striate cortex in the squirrel monkey (Saimiri sciureus). J Neurosci.1983;3:673–702. [PubMed]
Fitzpatrick D, Lund JS, Schmechel DE, Towles AC. Distribution of GABAergic neurons and axon terminals in the macaque striate cortex. J Comp Neurol.1987;264:73–91. [PubMed]
Fitzpatrick D, Usrey WM, Schofield BR, Einstein G. The sublaminar organization of corticogeniculate neurons in layer 6 of macaque striate cortex. Vis Neurosci.1994;11:307–315. [PubMed]
Franz Nissl (1860-1919), neuropathologist. JAMA. 1968;205:460–461.
Fries W, Distel H. Large layer V1 neurons of monkey striate cortex (Meynert cells) project to the superior colliculus. Proc R Soc Lond B Biol Sci. 1983;219:53–59.[PubMed]
Fries W, Keizer K, Kuypers HG. Large layer VI cells in macaque striate cortex (Meynert cells) project to both superior colliculus and prestriate visual area V5. Exp Brain Res. 1985;58:613–616. [PubMed]
Fries W. Pontine projection from striate and prestriate visual cortex in the macaque monkey: an anterograde study. Vis Neurosci. 1990;4:205–216. [PubMed]
Fritsch G, Hitzig E. Ueber die elektrische Erregbarkeit des Grosshirns. On the electrical excitability of the cerebrum. Archiv fur Anatomie, Physiologie und wissenschaftliche Medizin. 1870;37:300–332.
Graham J. Some topographical connections of the striate cortex with subcortical structures in Macaca fascicularis. Exp Brain Res. 1982;47:1–14. [PubMed]
Grosof DH, Shapley RM, Hawken MJ. Macaque V1 neurons can signal ‘illusory’ contours. Nature. 1993;365:550–552. [PubMed]
Gutierrez C, Cusick CG. Area V1 in macaque monkeys projects to multiple histochemically defined subdivisions of the inferior pulvinar complex. Brain Res.1997;765:349–356. [PubMed]
Hartline HK. The response of single optic nerve fibers of the vertebrate eye to the illumination of the retina. Am J Physiol. 1938;121:400–415.
Hendry SH, Yoshioka T. A neurochemically distinct third channel in the macaque dorsal lateral geniculate nucleus. Science. 1994;264:575–577. [PubMed]
Hendrickson AE, Wilson JR, Ogren MP. The neuroanatomical organization of pathways between the dorsal lateral geniculate nucleus and visual cortex in Old World and New World primates. J Comp Neurol. 1978;182:123–136. [PubMed]
Hilgetag CC, O’Neill MA, Young MP. Indeterminate organization of the visual system. Science. 1996;271:776–777. [PubMed]
Hubel DH, Wiesel TN. Receptive fields of single neurones in the cat’s striate cortex. J Physiol. 1959;150:91–104.
Hubel DH, Wiesel TN. Receptive fields, binocular interaction and functional architecture in the cat’s visual cortex. J Physiol. 1962;160:106–154. [PubMed]
Hubel DH, Wiesel TN. Receptive fields and functional architecture of the monkey striate cortex. J Physiol. 1968;195:215–243. [PubMed] [Free Full text in PMC]
Hubel DH, Wiesel TN. Laminar and columnar distribution of geniculo-cortical fibers in the macaque monkey. J Comp Neurol. 1972;146:421–450. [PubMed]
Hubel DH, Wiesel TN. Sequence regularity and geometry of orientation columns in the monkey striate cortex. J Comp Neurol. 1974;158:267–293. [PubMed]
Hubel DH, Wiesel TN, Stryker MP. Orientation columns in macaque monkey visual cortex demonstrated by the 2-deoxyglucose autoradiographic technique.Nature. 1977;269:328–330. [PubMed]
Hubel DH. Exploration of the primary visual cortex, 1955–78. Nature. 1982;299:515–524. [PubMed]
Kandel ER. Perception of motion, depth, and form. In: Kandel ER, Schwartz JH, Jessel TM, editors. Principles of Neural Science. Norwalk (CT): Appleton & Lange; 1991.
Kuffler SW. Discharge patterns and functional organization of mammalian retina. J Neurophysiol. 1953;16:37–68. [PubMed]
Lachica EA, Casagrande VA. Direct W-like geniculate projections to the cytochrome-oxidase (CO) blobs in primate visual cortex: axon morphology. J Comp Neurol.1992;319:141–158. [PubMed]
Leventhal AG, Thompson KG, Liu D, Zhou Y, Ault SJ. Concomitant sensitivity to orientation, direction, and color of cells in layers 2, 3, and 4 of monkey striate cortex. J Neurosci. 1995;15:1808–1818. [PubMed]
Leventhal AG, Wang Y-C, Schmolesky MT, Zhou Y. Neural correlates of boundary perception. Vis Neurosci. 1998;15:1107–1118. [PubMed]
Livingstone MS, Hubel DH. Thalamic inputs to cytochrome oxidase-rich regions in monkey visual cortex. Proc Natl Acad Sci U S A. 1982;79:6098–6101. [PubMed] [Free Full text in PMC]
Livingstone MS, Hubel DH. Connections between layer 4B of area 17 and the thick cytochrome oxidase stripes of area 18 in the squirrel monkey. J Neurosci.1987;7:3371–3377. [PubMed]
Livingstone MS. Mechanisms of direction selectivity in macaque V1. Neuron. 1998;20:509–526. [PubMed]
Lund JS. Organization of neurons in the visual cortex, area 17, of the monkey (Macaca mulatta). J Comp Neurol. 1973;147:455–496. [PubMed]
Lund JS, Boothe RG. Interlaminar connections and pyramidal neuron organization in the visual cortex, area 17, of the macaque monkey. J Comp Neurol.1975;159:305–334.
Lund JS, Lund RD, Hendrickson AE, Bunt AH, Fuchs AF. The origin of efferent pathways from the primary visual cortex, area 17, of the macaque monkey as shown by retrograde transport of horseradish peroxidase. J Comp Neurol. 1975;164:287–303. [PubMed]
Lund JS. Local circuit neurons of macaque moniey striate cortex. I. Neurons of laminae 4C and 5A. J Comp Neurol. 1987;257:60–92. [PubMed]
Lund JS, Hawken MJ, Parker AJ. Local circuit neurons of macaque moniey striate cortex. II. Neurons of laminae 5B and 6. J Comp Neurol. 1988;276:1–29.[PubMed]
Lund JS, Yoshioka T. Local circuit neurons of macaque moniey striate cortex. III. Neurons of laminae 4B, 4A, and 3B. J Comp Neurol. 1991;311:234–258.[PubMed]
Lund JS, Wu CQ. Local circuit neurons of macaque moniey striate cortex. IV. Neurons of laminae 1–3A. J Comp Neurol. 1997;384:109–126. [PubMed]
Maunsell JH, Van Essen DC. The connections of the middle temporal visual area (MT) and their relationship to a cortical hierarchy in the macaque monkey. J Neurosci. 1983;3:2563–2586. [PubMed]
Maunsell JH, Gibson JR. Visual response latencies in striate cortex of the macaque monkey. J Neurophysiol. 1992;68:1332–1344. [PubMed]
Maunsell JH, Ghose GM, Assad JA, McAdams CJ, Boudreau CE, Noerager BD. Visual response latencies of magnocellular and parvocellular LGN neurons in macaque monkeys. Vis Neurosci. 1999;16:1–14. [PubMed]
Mountcastle VB. Modality and topographic properties of single neurons of cat’s somatic sensory cortex. J Neurophysiol. 1957;20:408–434. [PubMed]
Nowak LG, Munk MH, Girard P, Bullier J. Visual latencies in areas V1 and V2 of the macaque monkey. Vis Neurosci. 1995;12:371–384. [PubMed]
Nowak LG, Bullier J. The timing of information transfer in the visual system. In: Kaas JH, Rockland K, Peters A, editors. Cerebral cortex. New York: Plenum Press; 1998. p. 205–241.
Ogren M, Hendrickson A. Pathways between striate cortex and subcortical regions in Macaca mulatta and Saimiri sciureus: evidence for a reciprocal pulvinar connection. Exp Neurol. 1976;53:780–800. [PubMed]
O’Kusky J, Colonnier M. A laminar analysis of the number of neurons, glia, and synapses in the visual cortex (area 17) of adult macaque monkeys. J Comp Neurol.1982;210:278–290. [PubMed]
Olavarria JF, Van Essen DC. The global pattern of cytochrome oxidase stripes in visual area V2 of the macaque monkey. Cereb Cortex. 1997;7:395–404.[PubMed]
Penfield W, Boldrey E. Somatic motor and sensory representation in the cerebral cortex of man as studied by electrical stimulation. Brain. 1937;60:389–443.
Perkel DJ, Bullier J, Kennedy H. Topography of the afferent connectivity of area 17 in the macaque monkey: a double-labelling study. J Comp Neurol.1986;253:374–402. [PubMed]
Peters A, Sethares C. Organization of pyramidal neruons in rhesus monkey primary visual cortex. J Comp Neurol. 1991;306:1–23. [PubMed]
Peterhans E, von der Heydt R. Mechanisms of contour perception in monkey visual cortex. II. Contours bridging gaps. J Neurosci. 1989;9:1749–1763. [PubMed]
Polyak S. The vertebrate visual system. Chicago: University of Chicago Press. 1957
Powell TP, Mountcastle VB. Some aspects of the functional organization of the cortex of the postcentral gyrus of the monkey: a correlation of findings obtained in a single unit analysis with cytoarchitecture. Bull Johns Hopkins Hosp. 1959;105:133–162. [PubMed]
Rezak M, Benevento LA. A comparison of the organization of the projections of the dorsal lateral geniculate nucleus, the inferior pulvinar and adjacent lateral pulvinar to primary visual cortex (area 17) in the macaque monkey. Brain Res. 1979;167:19–40. [PubMed]
Ringach DL, Hawken MJ, Shapley R. Dynamics of orientation tuning in macaque primary visual cortex. Nature. 1997;387:281–284. [PubMed]
Rockland KS, Saleem KS, Tanaka K. Divergent feedback connections from areas V4 and TEO in the macaque. Vis Neurosci. 1994;11:579–600. [PubMed]
Schiller PH, Finlay BL, Volman SF. Quantitative studies of single-cell properties in monkey striate cortex. I. Spatiotemporal organization of receptive fields. J Neurophysiol. 1976;39:1288–1319. [PubMed]
Schmolesky MT, Wang YC, Hanes DP, Thompson KG, Leutgeb S, Schall JD, Leventhal AG. Signal timing across the macaque visual system. J Neurophysiol.1998;79:3272–3278. [PubMed]
Schmolesky MT, Wang Y, Pu M, Leventhal AG. Degradation of stimulus selectivity of visual cortical cells in senescent rhesus monkeys. Nat Neurosci. 2000;3:384–390. [PubMed]
Shipp S, Zeki S. Segregation of pathways leading from area V2 to areas V4 and V5 of macaque monkey visual cortex. Nature. 1985;315:322–325. [PubMed]
Shipp S, Zeki S. The organization of connections between areas V5 and V1 in macaque monkey visual cortex. Eur J Neurosci. 1989;1:309–332. [PubMed]
Shipp S, Zeki S. The organization of connections between areas V5 and V1 in macaque monkey visual cortex. Eur J Neurosci. 1989;1:333–354. [PubMed]
Somogyi P, Kisvarday ZF, Martin KA, Whitteridge D. Synaptic connections of morphologically identified and physiologically characterized large basket cells in the striate cortex of cat. Neuroscience. 1983;10:261–294. [PubMed]
Suzuki W, Saleem KS, Tanaka K. Divergent backward projections from the anterior part of the inferotemporal cortex (area TE) in the macaque. J Comp Neurol.2000;422:206–228. [PubMed]
Talbot SA, Marshall WH. Physiological studies on neural mechanisms of visual localization and discrimination. Am J Ophthal. 1941;24:1255–1263.
Thompson JM, Woolsey CN, Talbot SA. Visual areas I and II of cerebral cortex of rabbit. J Neurophysiol. 1950;13:277–288. [PubMed]
Thompson KG, Hanes DP, Bichot NP, Schall JD. Perceptual and motor processing stages identified in the activity of macaque frontal eye field neurons during visual search. J Neurophysiol. 1996;76:4040–4055. [PubMed]
Ungerleider LG, Desimone R. Projections to the superior temporal sulcus from the central and peripheral field representations of V1 and V2. J Comp Neurol.1986a;248:147–163. [PubMed]
Ungerleider LG, Desimone R. Cortical connections of visual area MT in the macaque. J Comp Neurol. 1986b;248:190–222. [PubMed]
Van Essen DC, Newsome WT, Maunsell JH, Bixby JL. The projections from striate cortex (V1) to areas V2 and V3 in the macaque monkey: asymmetries, areal boundaries, and patchy connections. J Comp Neurol. 1986;244:451–480. [PubMed]
Van Essen DC, Anderson CH Felleman DJ (1992) Information processing in the primate visual system: an integrated systems perspective. Science 255: 419-423.
von der Heydt R, Peterhans E, Baumgartner G. Illusory contours and cortical neuron responses. Science. 1984;224:1260–1262. [PubMed]
von der Heydt R, Peterhans E. Mechanisms of contour perception in monkey visual cortex. I. Lines of pattern discontinuity. J Neurosci. 1989;9:1731–1748.[PubMed]
Yabuta NH, Callaway EM. Functional streams and local connections of layer 4C neurons in primary visual cortex of macaque monkey. J Neurosci. 1998a;18:9489–9499. [PubMed]
Yabuta NH, Callaway EM. Cytochrome-oxidase blobs and intrinsic horizontal connections of layer 2/3 pyramidal neurons in primate V1. Vis Neurosci.1998b;15:1007–1027. [PubMed]
Last Update: June 14, 2007.
|
The author Matttew Smolesky has a PhD in Neuroscience from the Neurobiology and Anatomy department, University of Utahand an MA in Experimental Psychology. He has a record of success in research, teaching, administration, federal policy, mentoring, and grant writing. His experience in neuroscience and experimental psychology was initially in the field of visual perception and cortical recording. For the last 14 years he has been chair or director of neuroscience and psychology programs (Weber College, Utah). Matt and has spent 2 years in federal science and technology policy. He has strong skills in collaboration, program building and management, research methodology and practice, and communication of science and technology. Matt is presently Professor and chair at Georgia Gwinnett College, Laurenceville, Georgia, USA. Matthew Smolesky can be reached at mschmolesky@ggc.edu |
 |